By: Greg Hohertz, Blue Medora
Over the years, vCenter has gained more and more importance. As a command center to central administration and a focal point for API access to your vSphere environment, vCenter is a cog in your virtualization environment that brings everything to a halt if it’s not performing or unavailable.
In this series, we will take a look at how we can monitor VMware vCenter leveraging vRealize Operations without having to deploy additional agents or code to vCenter or Microsoft SQL Server. Monitoring remotely is ideal because it removes any dependence on agents that have to be deployed and maintained on the target system, thus reducing the complexity of implementing and supporting your monitoring environment.

Figure 1: Monitoring vCenter and vPostgres Remotely with vRealize Operations
I will start by pointing out that VMware does provide a solution for monitoring vCenter which can be found in the Solution Exchange. This is an agent-based solution which incorporates a number of Hyperic (now Endpoint Operations, or EP Ops) agents. While this solution does provide a great option for monitoring vCenter, I prefer to perform my monitoring without having to install agents onto my pristine OVA.
In part one of this series, we will start with leveraging the metrics that are provided natively with the vSphere Management Pack along with the Blue Medora’s vRealize Operations Management Pack for PostgreSQL. The vSphere Management Pack will give us some insight into the Virtual Machine, Datastore, and ESXi Host on which the vCenter server resides. With the PostgreSQL Management Pack, we will remotely connect to vCenter’s underlying vPostgres database.
To get started, we’ll need to open up the vPostgres database on the vCenter server to allow connections from our vRealize Operations Manager’s collector and create a user which vRealize Operations will use to gather data. To accomplish this:
- SSH into your vCenter server using your favorite SSH client
- Enable BASH access by typing “shell.set –enabled TRUE”
- Launch your BASH shell by typing “shell”
- First, we’ll edit /storage/db/vpostgres/pg_hba.conf to allow remote connections to our vPostgres database.
- Add a new line at the end of the file that looks something like this:
a) “host all all 10.77.8.0/24 md5”
b) Change “10.77.8.0” to the subnet on which your vRealize Operations collector resides, or if you want you could limit the connection to a specific IP by using notation such as: “10.77.8.124/32” where 10.77.8.124 is the IP address of the collector. - Next, we’ll configure vPostgres to listen on all network interfaces, instead of just the localhost. Edit /storage/db/vpostgres/postgresql.conf
- Change “listen_addresses” to an asterisk “*”.
- Now, we need to restart vPostgres in order for the changes to take effect by executing “/etc/init.d/vmware_vpostgres restart”
- Next, we’ll create a user which vRealize Operations will use to connect remotely. Start by launching the Postgres console by running: “/opt/vmware/vpostgres/current/bin/psql -U postgres”.
- Let’s create our user by issuing command: “CREATE USER bmvrops WITH PASSWORD ‘mypassword1’”
- Next, let’s grant that user access to read vPostgres data: “GRANT SELECT ON ALL TABLES IN SCHEMA public to bmvrops”
Now that we are able to remotely connect to our vCenter’s vPostgres database, we’ll install and license the Blue Medora Management Pack for PostgreSQL, which can be found here. Once the Management Pack is installed by following the simple steps in the Installation Guide, we will configure an adapter instance to connect to our vCenter database.
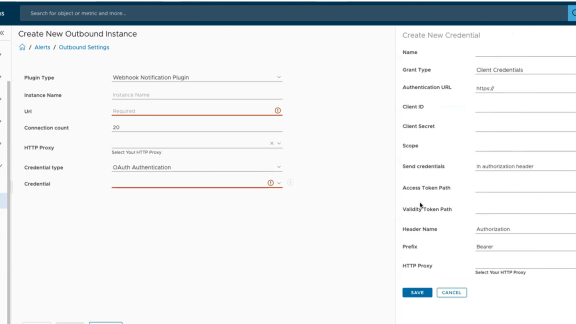
To add a Blue Medora Management Pack for PostgreSQL vPostgres adapter instance to monitor vCenter:
- Select the “PostgreSQL Adapter” solution
- Click on the gears in the toolbar
- For Display Name, enter the name of this vCenter server
- Next, enter the hostname of the vCenter server
- Enter ‘VCDB” for database
- Click on the green plus symbol to add a new set of credentials
- Enter a friendly name for this set of credentials
- Enter the username and password you created in step 10 above
- Enter a username and password which has access to the vRealize Operations REST API (we’re using “admin” for this example).
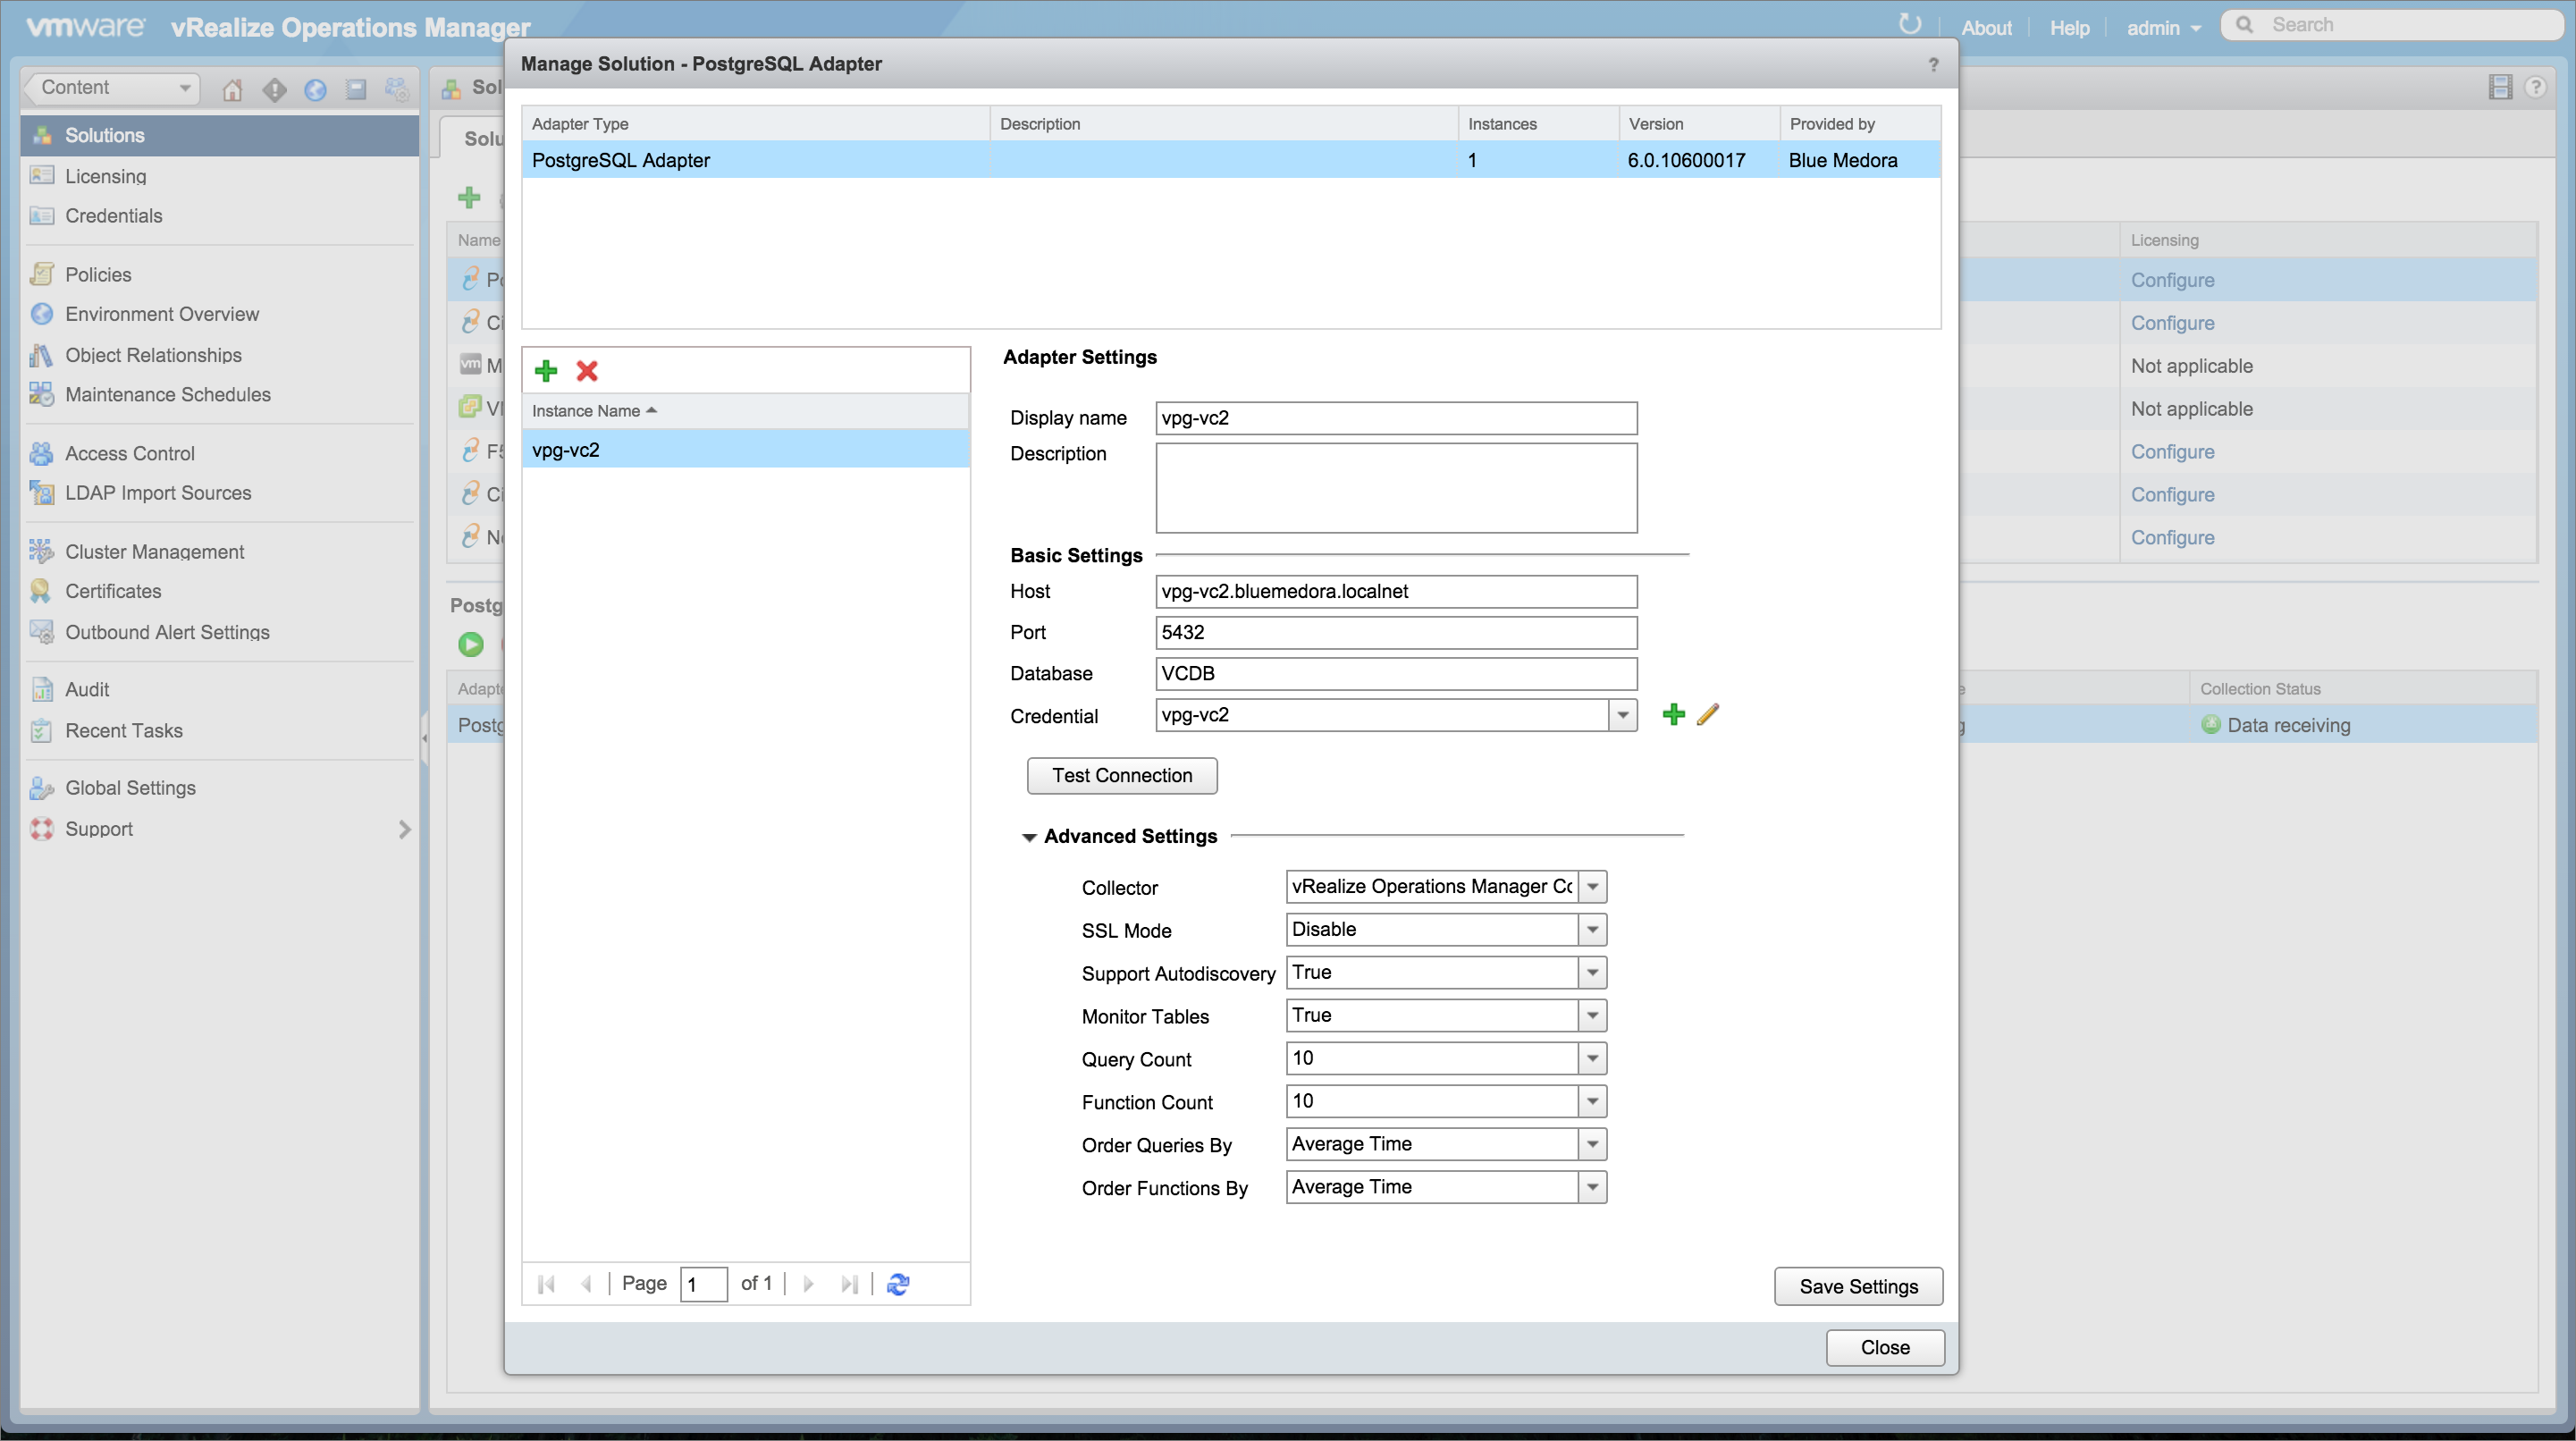
Figure 2: Adding the vCenter Postgres Database Instance
After waiting 15 or so minutes, we should now have vPostgres performance data from vCenter. Next, let’s create a relationship from our vCenter Server to the vPostgres database so that we can navigate to it in our Inventory Explorer and create dashboards which have a mashup of vCenter data and vPostgres data. To accomplish this:
- In vRealize Operations, navigate to Administration
- Select “Object Relationships”
- On the left hand side, expand “Object Types”
- Find “vCenter Server” and left click on it
- In the next pane over, select your vCenter server by left clicking on it
- In the right hand pane, expand “Object Types”
- Find “PostgreSQL Instance” and left-click on it
- In the second from the right pane you see your PostgreSQL instances that are monitored by vRealize Operations. Select the database which resides on your vCenter and drag it over to the vCenter server in the pane to the left.
- We now have a relationship in vRealize Operations from our vCenter Server to the vPostgres database which resides on it.

Figure 3: Creating the Relationship Between vCenter and vPostgres
Next, we’ll import a dashboard which will present some key performance indicators from our vCenter server. This includes CPU, Memory, Datastore and vPostgres performance. First, we will need to create a “Metric Config” which tells our dashboard what metrics to display for our vPostgres performance.
- Navigate to “Content”
- Select “Manage Metric Config”
- Click on the green plus sign
- Enter a name for this Metric Config – “BlueMedora-vCenter-PG.xml”
- Copy the contents from the “BlueMedora-vCenter-PG.xml” file found in the zip file at the end of this article.
- Click Save.
Next, we’ll import our custom dashboard:
- Navigate to “Content”
- Select “Dashboards”
- Select the gear, and then “Import Dashboards”
- Import “Blue Medora vCenter.json” found in this zip file.
Now we have a new dashboard called “Blue Medora vCenter”, which shows us the overall health of our vCenter server – with CPU, Memory, Datastore, and vPostgres performance and trending. Stay tuned for part 2 of this series, where we’ll look at how we can remotely monitor our Microsoft SQL database used by vCenter.