

Virtual machines have been part of our infrastructure for decades. They evolved from simple time-sharing of multiple users using the same hardware to complex hypervisors that can emulate completely virtual hardware. Nowadays hundreds of VMs can run on the same host. Each of them running different operating systems, using different sets of the hardware resources or even using non-existing, emulated hardware. Can you imagine the complexity of this task? Can you imagine the complex problems that engineers face while designing, developing, debugging and maintaining these systems? Although there are a lot of tools for tracing the operating system low-level internals, there is a lack of instruments for analyzing host-guest interactions at the OS kernel level. Or even more complex relations between VMs running on the same host.
The VMware Open Source team has been working to address this gap. By combining and enhancing already existing tools and frameworks, we came up with a robust and easy-to-use solution that greatly increases the observability of host-guest interactions. It works with Linux kernel running on both host and guest machines and is based entirely on open source tools:
- Ftrace is the official tracing framework of the Linux kernel. It is built in the kernel and enabled by default even in production kernels, as it has really low overhead. It can trace almost every corner of the kernel. It is used to collect traces from the host and guest kernels.
- Trace-cmd is a user space tool that controls ftrace, gathers traces and stores them in a file. Tracing information can be huge, in heavily loaded and large systems with a lot of CPU cores, gigabytes of trace data can be produced each second. Trace-cmd is responsible for configuring and starting the trace simultaneously on the host and all guest systems, transfers that huge amount of data into the host context in real time during the trace and stores that into files. It also synchronizes the timestamps of all trace events.
- Kernelshark is a graphical tool capable of visualizing huge amounts of trace data, gathered by trace-cmd. It has a great plugin-based design, which allows it to easily be extended with new functionalities for visualizing and analyzing data.
So, what is needed:
- First, ftrace must be enabled in the Linux kernels running on the host and guests machines. That is done in the kernel compile time, but as it is enabled by default in almost all Linux distributions – you most likely already have it.
- Trace-cmd version 2.9 or greater must be installed in the host and all guest machines that will be traced. There are Debian and Fedora packages, but you can also easily compile and install it from the sources. Note that in order to interact with ftrace, root privileges are needed on all machines.
- KernelShark version 2.0, to visualize the collected traces.
What a typical tracing session looks like:
- Trace-cmd must be run in agent mode on all guest machines as it listens for incoming tracing requests and executes them: trace-cmd agent
- A tracing session is initiated from the host contex: trace-cmd record -e kvm -e sched -A debian -e all. We are interested in all kvm and sched related kernel events from the host kernel and all events from the kernel of the guest with the name debian. Multiple guests can be traced with a single command. A bunch of trace files are generated by this command – one file with the host traces and one file for each traced guest machine.
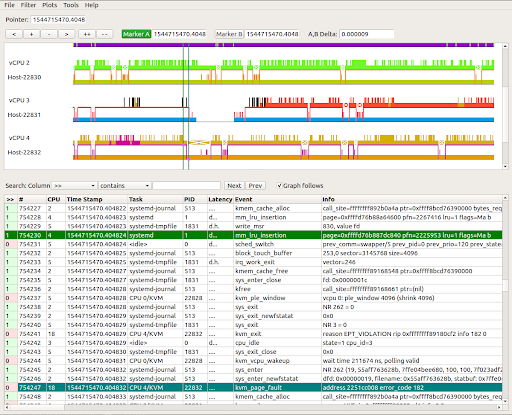
- And finally, KernelShark can be used to see what we just collected. You can see each task on the host that runs a corresponding guest virtual CPU and all traced kernel events that occurred in the host and guest context, synchronized in the same time space in the graphic depiction below:
What’s next in the world of tracing virtual machines? What if we could apply the same logic to tracing containers? The VMware Open Source team is working on that very enhancement. Stay tuned to learn more!
Additional Resources by Steven Rostedt:
Understanding the Linux Kernel via Ftrace
See What Your Computer Is Doing With Ftrace Utilities
Learning The Linux Kernel With Tracing
ftrace: Where Modifying A Running Kernel All Started
Stay tuned to the Open Source Blog and follow us on Twitter for more deep dives into the world of open source contributing.


