What about literally correlating business data with IT metrics? For example adding some stock quota to vCenter Operations? Not an everyday use case, but at least imaginable: how the stock of your enterprise relates to the market and to your IT or possibly even production numbers?
While presenting vCenter Operations and explaining the concept of dynamic thresholds and anomalies some popular analogies are used. For example the comparison to the heartbeat: healthy heart rate depends on your age and on the context: heart rate of 120 is high if you just sit but may be fine if you are running or attending your own wedding ceremony. This example shows why hard thresholds do not help and self-learning analytics engine is required to monitor complex systems.
We also explain, that vCenter Operations analyzes every metric, no matter if it comes from vCenter, operating system or any other source. Getting biometrical data collected and transferred to computer readable format would require additional gadgets (which are becoming more and more popular), but what about some other data, for example – stock quotes? (your stock portfolio may be related to your heart rate too, if you are heavily invested). So before adding biometrical data, lets start with stocks.
The idea of using vCenter Operations for stock analysis is not new, however I have not seen any implementation described in detail yet. Surprisingly this can be done so easily, and only requires very basic shell script and Internet access.
First we need to get stock quotes from somewhere. I choose Yahoo because I am able to pull any stock data as CSV and it offers a lot of formatting options explained in Sean Walther’s blog. So getting data on vC Ops command line and choosing ” sb2c1p2″
- s = symbol
- b2 = bid (Real-time)
- c1 = change
- p2 = percent change
would result in following output:
vcops:~ # curl -s "http://download.finance.yahoo.com/d/quotes.csv?s=VMW,AAPL,IBM,HPQ,GOOG&fc1p2"

"VMW",110.61,-0.30,"-0.31%"

"AAPL",102.06,+1.241,"+1.23%"

"IBM",194.16,-0.74,"-0.38%"

"HPQ",38.24,+0.33,"+0.87%"

"GOOG",573.00,-6.86,"-1.19%"
The output looks great for humans so far but it is not directly consumable by vC Ops. To create vC Ops metrics from it we need to create time series data. That means we need a time stamp and a numeric value. All the special characters have to be removed and we need a unique field separator. As some names also contains commas and possibly other special characters, I will skip the company name option (n) and use “tr” to remove all the “+” and “%”:
vcops:~ # curl -s "http://download.finance.yahoo.com/d/quotes.csv?s=VMW,AAPL,IBM,HPQ,GOOG&f=sb2c1p2" | tr -d ["+%]

VMW,110.61,-0.30,-0.31

AAPL,102.06,1.241,1.23

IBM,194.16,-0.74,-0.38

HPQ,38.24,0.33,0.87

GOOG,573.00,-6.86,-1.19
Now the output looks like a time series data and can be fed in to vC Ops. On the vC Ops side the http_post adapter (which is installed by default) will happily accept it.
So the script example for “get_stock_data_and_post_it_to_vCOps.sh” could look like this:
OLDIFS=$IFS

IFS=","

#### Adapt settings to your environment

#vC Ops URL

export VCOPSURL="https://YOUR_VCOPS_IP/HttpPostAdapter/OpenAPIServlet"

# vC Ops user name and password for http_Post

export POSTID="user:password"

# Your favorite stock symbols:

export STOCKLIST="VMW,AAPL,IBM,HPQ,GOOG"

#### Other variables:

export POSTFILE="/tmp/stock-postfile"

export INPUT="/tmp/stocks.csv"

export EPOCHMS=$(date +%s000)

curl -s "http://download.finance.yahoo.com/d/quotes.csv?s=$STOCKLIST&f=sb2c1p2" | tr -d ["+%] > $INPUT

while read symbol ask change change_in_percent change_in_percent_52_low change_in_percent_52_high

do

curl -ksS -u $POSTID -d "$(printf "$symbol,YAHOO,STOCK,,,300,,,nStock|Bid,1,NoValue,$EPOCHMS,$asknStock|Change,1,NoValue, $EPOCHMS,$changenStock|Change_in_percent,1,NoValue,$EPOCHMS,$change_in_percent")" $VCOPSURL

echo "$(printf "$symbol,YAHOO,STOCK,,,300,,,nStock|Bid,1,NoValue,$EPOCHMS,$asknStock|Change,1,NoValue,$EPOCHMS,$changenS tock|Change_in_percent,1,NoValue,$EPOCHMS,$change_in_percent")" $VCOPSURL

done < $INPUT

IFS=$OLDIFS
Let me explain what the script does: it gets the data from yahoo, pipes it to the file ($INPUT), then it reads the file line by line and assigns variables for each field (symbol, bid, change,change_in_percent, change_in_percent_52_low change_in_percent_52_high).
After variables are assigned it uses second curl command to post the content to the rest api of vC Ops. It also adds Unix time stamp to each metric.
The format expected by vC Ops is documented under following URL (replace “vcops” with your vCenter operations IP) https://vcops/HttpPostAdapter/#addGeneralMetricObservations.
It contains one header line for each resource followed by lines containing metrics, time stamp and values. So the result for one stock symbol (VMW) creating a new adapter kind (YAHOO) and new resource kind (STOCK), expecting metrics every 5 minutes (300) may look like this:
VMW,YAHOO,STOCK,,,300,,,

Stock|Bid,1,NoValue,1404419328000,99.70

Stock|Change,1,NoValue,1404419328000,0.74

Stock|Change_in_percent,1,NoValue,1404419328000,0.76

Stock|Change_in_percent_52_high,1,NoValue,1404419328000,-12.90

Stock|Change_in_percent_52_low,1,NoValue,1404419328000,51.02
So now the script is ready and we may run it several times from the command line:
vcops:~/tomas # while `true`; do sh get_stock_data_and_post_it_to_vCOps.sh; sleep 180; done
If you script works as expected, you may consider adding it to the crontab (with crontab -e command). My entry looks like this:
*/3 * * * * /root/get_stock_data_and_post_it_to_vCOps.sh &> /dev/null
In the custom ui -> environment overview open “Adapter Kind” and select “Yahoo”:
Selecting a resource and clicking on “Details” icon (on the buttom) will bring me to the following screen, where you can check metrics are starting to come in. The icon for the resource kind can be changed under Environment -> Advanced -> Resource kind icons.
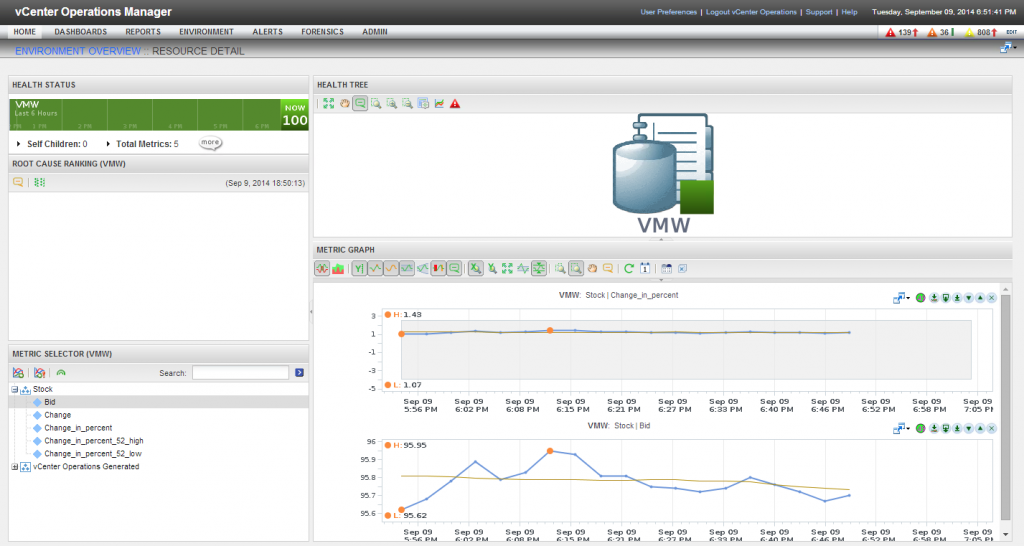
Now we can build any kind of dashboards to visualize the portfolio. I always prefer to select resource kinds in the widget configuration instead of selecting named resources, this way you may add any new stocks in the future and will not have to rebuild my dashboard.
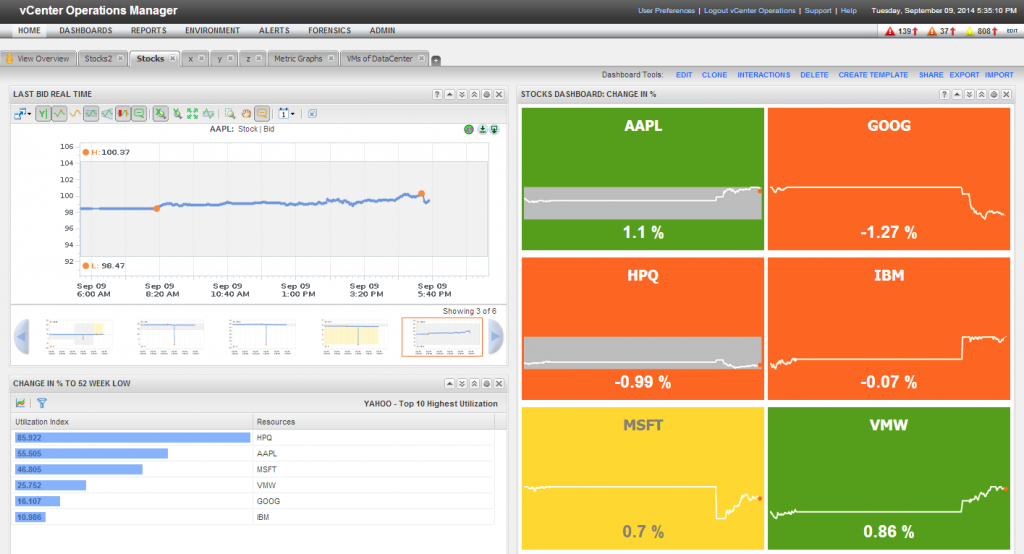
Disclaimer: Yahoo API used may be changed or removed by Yahoo at any time. This article is just an illustration on how easy new metrics can be integrated in to vCenter operations. You should not base your stock trading decisions on it alone. If you do, don’t blame vC Ops.


