We launched our VMware Horizon Cloud next-gen platform at VMware Explore US in 2022, which provides customers delivering virtual desktops and apps with a modern, new hybrid Desktop-as-a-Service (DaaS) architecture built around lowering costs and improving scalability. Following the initial release, at VMware Explore Europe 2022 we announced our intent to support hybrid cloud deployments, which we recently delivered with Horizon 8 in our 2303 release. Now we are excited to release new monitoring improvements for the Horizon Cloud next-gen environments. Let’s look at five of the top updates we have made to improve visibility across virtual desktops, app performance, and user experience.
1. Comprehensive visibility of resource usage and infrastructure monitoring
For IT admins, managing DaaS infrastructure can be complex and time-consuming if you do not have the right level of information available. Now from the Horizon Universal Console you can get detailed infrastructure and resource usage information for your VDI components available in Microsoft Azure environments. You have a wealth of information at your fingertips — including resource utilization, session information, VM usage, and infrastructure errors — that can be used for alerting. For example, knowing that some users are experiencing high CPU usage on their virtual desktops can help IT admins to identify which processes are consuming CPU on those desktops and then remediate the problem. All this information is consolidated in a default homepage view, and through filtering you can get relevant information by provider type or edge.
Furthermore, you can monitor health, usage, and topology information for critical VDI infrastructure components that are customer managed with Horizon 8 environments connected to Horizon Cloud next-gen. Infrastructure monitoring for connection servers and Unified Access Gateway (UAG) is now available for Horizon 8 deployments. This feature provides a single pane of glass for all the infrastructure and resource usage information, to understand which resources are being consumed, how they are performing, and if they are underutilized. This will help you make decisions such as balancing resource capacity to optimize your infrastructure cost without sacrificing user experience.
2. Simplified connection server monitoring
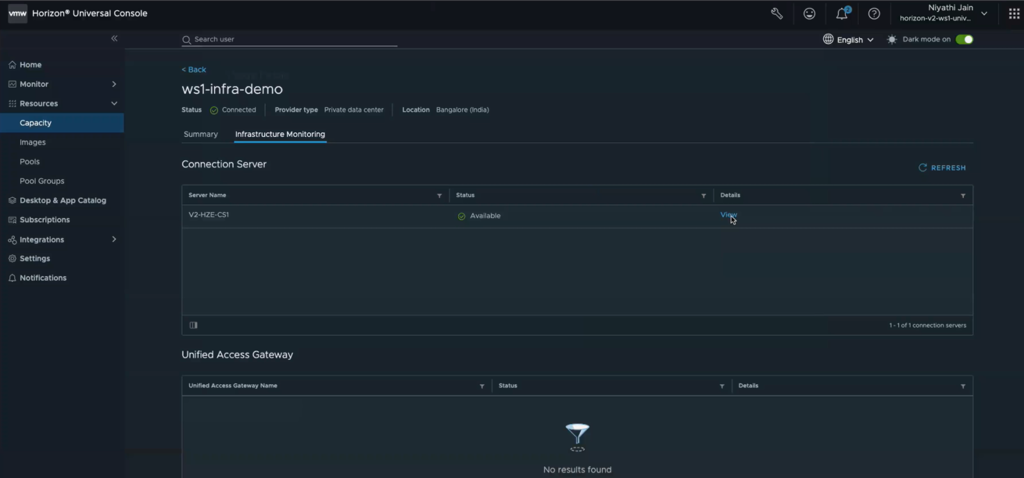
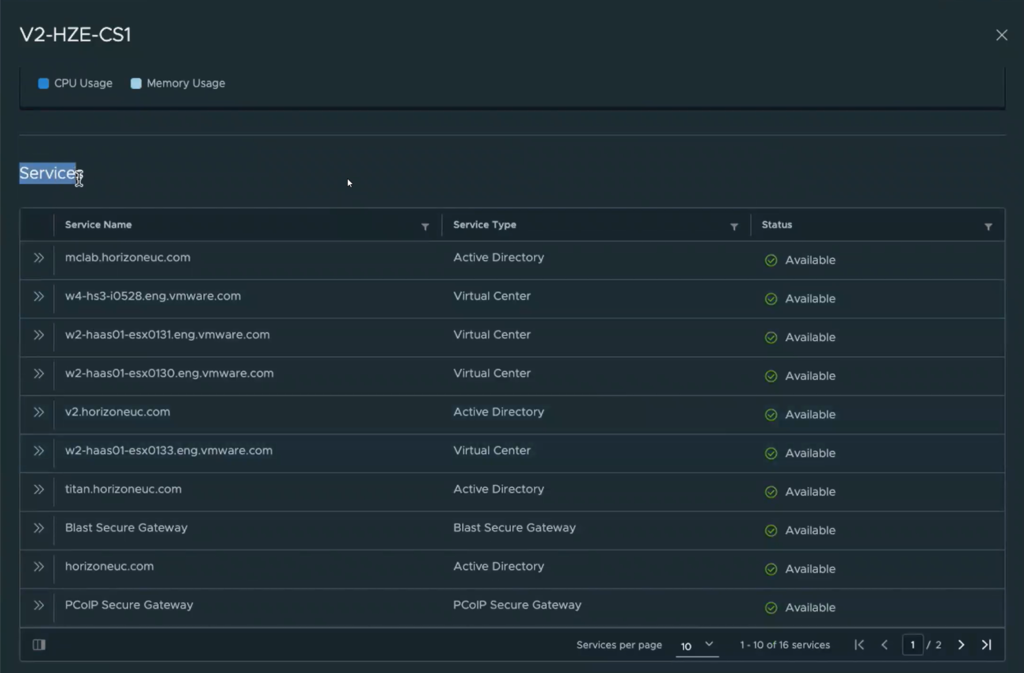
The Horizon Universal Console provides customers with a simplified way to manage desktops and apps whether from Horizon 8 pods or hosted natively on Microsoft Azure. (To learn more about how to deploy the Horizon Edge Gateway for Horizon 8, refer to this TechZone article.) With connection server monitoring specifically for Horizon 8 environments, IT admins can monitor the status of their connection servers from the “Edge details/Infrastructure monitoring” section under “Capacity” in the Horizon Universal Console (see the images below). This allows you to gather information about connection server availability status and certificate details very easily. You can simply double-click into each connection server appliance health for details such as VM CPU, memory, number of connections, and users connected. Additionally, IT admins can keep track of services connected to the connection servers, such as vCenter Service, Active Directory, and Secure Gateway Service. Having this information helps you understand the health of servers and, if required, turn some of the servers off depending on performance requirements. All the relevant information for connection servers is available at your fingertips.


3. Unified Access Gateway clusters and appliances monitoring
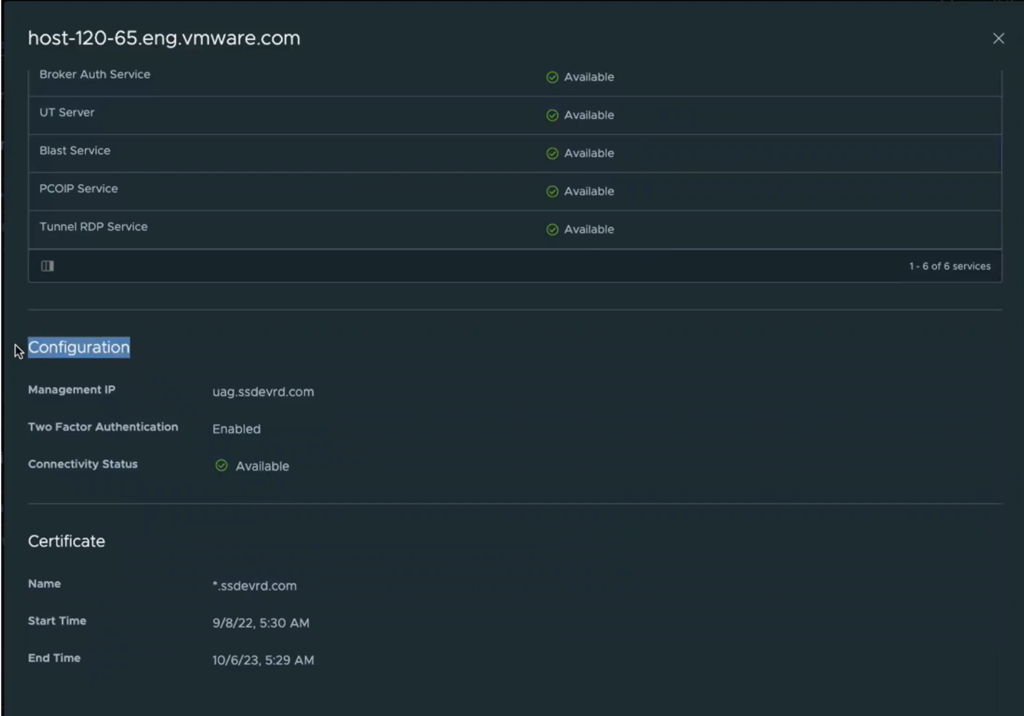
The Horizon Universal Console now empowers IT admins to monitor and manage UAG clusters and individual UAG appliances. The new UAG infrastructure monitoring dashboard gives usage (for example, a user’s sessions data) and UAG health information. You can now monitor the UAG appliance health and health status for the UAG services such as UAG VM CPU, memory utilization, and certificate information. This usage information can help you identify if UAG resources are lying idle and then manage UAG capacity requirements proactively. Please note that to monitor UAG, IT admins need to onboard their UAG onto the Horizon Cloud next-gen platform.

4. Topology data access from Horizon Universal Console
Now you can access topology data from your Horizon Universal Console. Through a new dashboard, IT can access information such as site, Horizon edge, pools, pool groups, entitlements, and more. This will help you improve overall user experience with detailed topology information, such as which sites are meeting your performance expectations.
5. Agent monitoring information sent to Splunk for Horizon Plus customers
Horizon Cloud next-gen customers who are leveraging the Horizon Standard Plus Subscription or the Horizon Enterprise Plus Subscription licenses can now choose to integrate with Splunk for observability. This will help those customers to consume information such as Horizon logs, metrics, and agent information within Splunk dashboards, which many organizations use for monitoring. For example, any agent errors that are critical and affect users connecting to virtual desktops can be sent to Splunk Enterprise. IT admins can use this information to identify various errors, like agent connectivity issues, and tackle them promptly.
We’re excited to help IT admins and our own operations team gain more visibility into virtual desktop and app delivery by releasing these latest updates in Horizon Cloud next-gen. To gain a deeper understanding of these updates and more, read our Horizon Cloud next-gen release notes.


