

In today’s IT environment, there are tens if not hundreds of metrics that could impact employee experience and productivity. In most cases, IT teams manually set up alerts for a number of parameters they are familiar with (think OS Crash and App crash rates) by guessing what is considered normal in an environment. While this is a good first line of defense, these alerting systems are often time consuming to update when what’s “normal” changes or when new data points are onboarded into the platform. Imagine instead a system that baselines metrics critical to employee experience and alerts admins when they stray from the normal without any setup or maintenance: enter Insights.
Last VMworld we announced Insights, a new feature in our Digital Employee Experience Management Solution, part of Workspace ONE Intelligence, to help IT admins eliminate the guess work when setting up thresholds and reduce alert fatigue. We’re proud to announce that Insights is now generally available in DEEM. Insights is an anomaly detection feature that uses machine learning models to baseline user experience KPIs in your environment and notify the administrator in the console when normal thresholds are broken.
Today we’ll go deeper into anomaly detection and how it will take your monitoring capabilities to the next level by decreasing the overall maintenance of your alerting strategy and surfacing insights in an efficient, explainable way.
What is Anomaly Detection?
Anomaly detection is a process that identifies data points, events or observations that deviate from a dataset’s normal behavior. In a Workspace ONE environment, our models will proactively surface critical issues like an abnormal increase in OS crash rates, app crashes, app hangs, and many more.

How does it work in DEEM?
Datapoints are automatically baselined by our algorithms so there is no need for the admin to setup anything to get Insights up and running. You can see Insights on the right side of the home DEEM dashboard below.

Once Insights appear on the dashboard, users will be able to drill down further to investigate the issue. We show the datapoint’s current value, a timeline of events related to the anomaly, an impact table showing summary information related to what devices might be impacted, and a comment section to collaborate with other admins over the life of the Insight.

How does it help you?
Devices or apps in an environment that are experiencing abnormal behavior are something that IT admins want to know about before employees begin to become frustrated and tickets start to come in. This new feature requires no setup and significantly decreases the amount of effort it takes to implement and maintain an effective anomaly detection strategy. Insights also allows for a greater breadth of variables to be monitored without any previous knowledge of normal levels from the admin as our algorithm learns what is normal in an environment from historical data. This feature removes the guesswork previously involved to determine the “normal” threshold for an event.
In the following graph the number of OS crash events becomes anomalous in an otherwise stable environment around noon on January 21st. Without having to click through dashboards and try and find historical “normal” levels, the admin can use the shaded portion of the chart to see what’s normal in the environment.

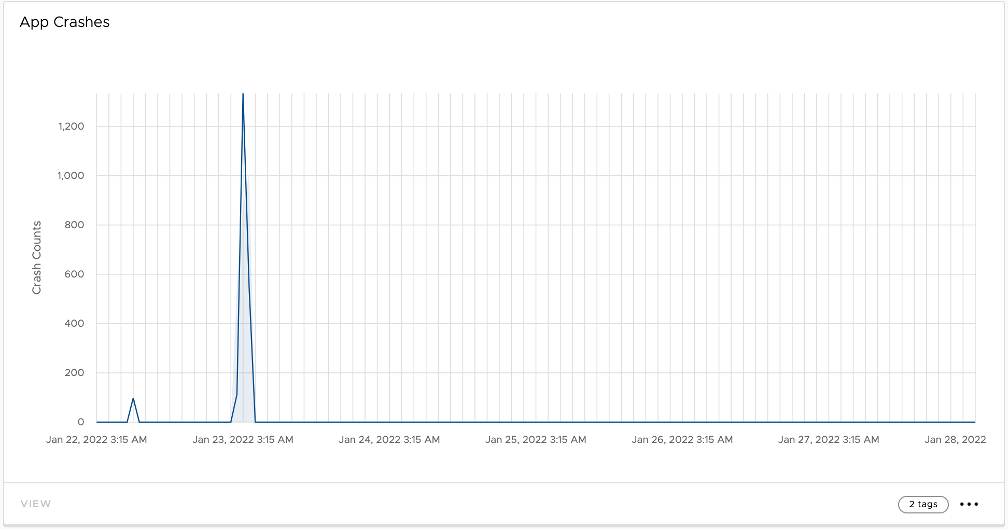
Another use case where Insights can be beneficial is if there is a huge spike in app crashes for a particular application. Insights informs admins so that IT admins can pro-actively take action to remediate the issue.
Our algorithm will continuously monitor and adjust thresholds as trends develop. Monitoring and adjusting what is considered normal is important to accommodate improvements/deterioration of a metric due to a long-term change in an environment. An example of this is if an app becomes much more stable after a new version is released, our algorithm will adjust what is considered an anomaly to a lower threshold taking into account the observed stability of the app.
To learn more, check out the demo video below and the product documentation.


