

Frontline workers rely on a diverse array of mobile devices to do their jobs. Whether smartphones, tablets, or rugged handheld computers, these devices play a crucial role in enabling mission-critical workflows. Furthermore, when these workflows are disrupted — due to downtime or the loss of devices — organizations face devastating consequences, including significant decline in overall productivity and financial losses. Considering this, we foresee organizations facing a pressing challenge that requires the adoption of analytics and automation tools. Proactively choosing this path will enable leadership to adopt well-informed, data-driven strategies to preemptively mitigate concerns before they escalate into potential crises.
VMware Workspace ONE Intelligence is a modern platform service delivering powerful insights, analytics, and automation across all your devices and applications to help mitigate this concern by delivering actionable insights to achieve proactive support and, ultimately, business outcomes.
What are Workspace ONE dashboard templates?
Dashboards are powerful tools in Workspace ONE Intelligence that supplement reporting capabilities with rich visualizations of available data. Earlier this year, we introduced dashboard templates in Workspace ONE Intelligence to streamline the process of creating dashboards tailored to your use case. As part of our ongoing effort to empower frontline organizations — such as healthcare, retail, and delivery businesses — we have added six frontline-specific dashboard templates. We designed these frontline dashboards to help you stay one step ahead, and they are available today in the Workspace ONE Marketplace.
- Shared devices
- Workspace ONE Launcher metrics for shared devices
- Device utilization and lost device prevention
- Zebra battery health
- Charging state of devices
- Available RAM/storage
Let’s look at the benefits these pre-built dashboard templates provide and how they can help you.
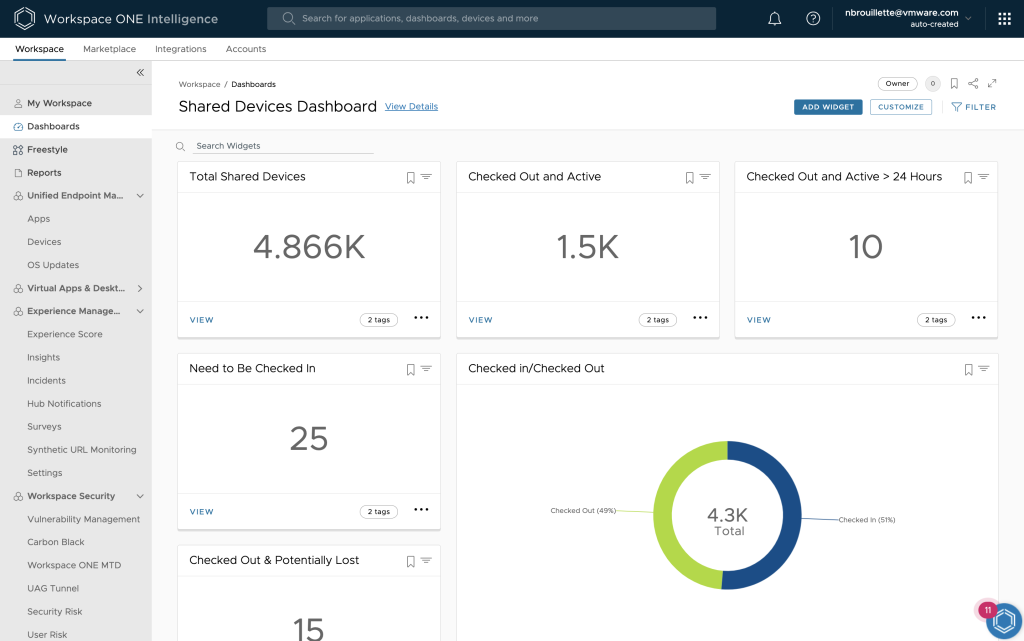
Shared devices
This first dashboard template is designed to monitor the status of devices shared among users, also called checked-in/checked-out devices. It provides information on various metrics, including the total number of shared devices deployed, the count of devices currently checked out and in an active state, and the devices that have been active while checked out for more than 24 hours. This information can be invaluable as it helps IT administrators perform necessary actions. For example, if a device remains active while checked out for over 24 hours, this could signal a potential issue with the device. In such cases, administrators might need to initiate the process of locating and checking the device back in for further assessment or troubleshooting.
Launcher metrics for shared devices
Workspace ONE Launcher is a pivotal solution for frontline devices that is commonly used to lock down shared or purpose-built devices into a single app or just a few select apps. This related dashboard template will significantly enhance admins’ capacity to proactively monitor and manage Launcher deployment for shared device use.
The Launcher metrics for shared devices dashboard proves valuable in several key scenarios. First, it enables administrators to establish clear expectations with end users about the check-out time, improving user experience and preventing device abandonment due to perceived delays. Next, it aids in identifying anomalies or potential issues. For example, the dashboard can help identify when the average time for check-in/check-out failure rates experiences sudden spikes. Last, it facilitates grouping by organization group level or device tag (a way to indicate retail store or warehouse location). These groupings allow insights into failure rate or completion times across different sites, enabling a deeper investigation into potential network-related problems or other issues affecting the flagged sites.
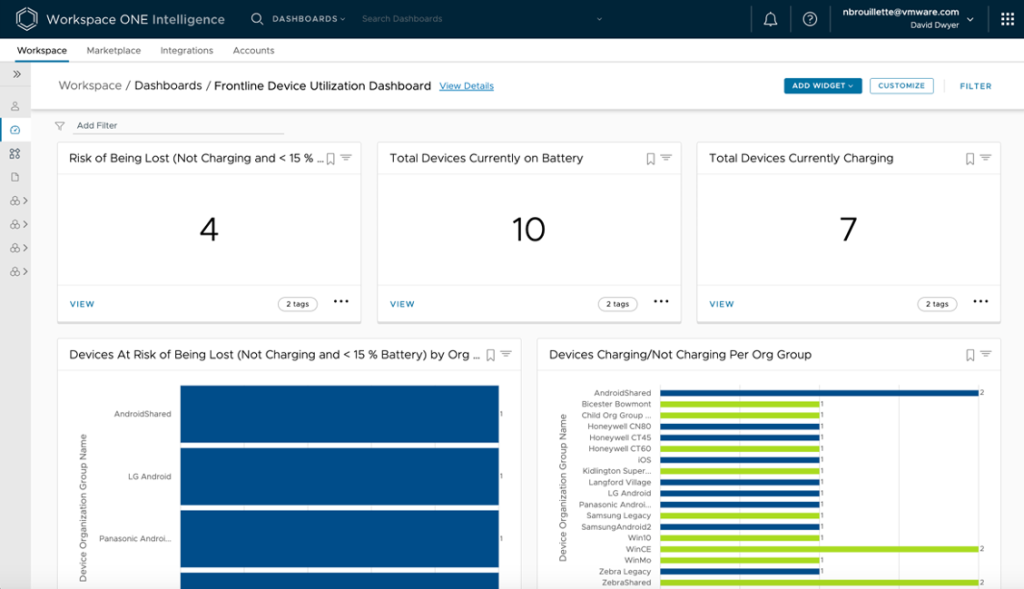
Device utilization and lost device prevention
A study from Kensington reveals that 4.3% of company-issued mobile devices are lost or stolen every year. The device utilization and lost device prevention dashboard template can help combat this statistic by providing a clear view of devices that are in use versus those that are charging. Its primary purpose is to facilitate a swift tracking process for potentially misplaced devices and to minimize the likelihood of loss or theft. The dashboard sends timely notifications to local managers when specific devices are not charging and have less than 15% battery power remaining. This proactive approach is crucial because once a device’s battery is depleted, locating it becomes significantly more challenging. By allowing administrators to identify devices at risk of loss or theft, this dashboard empowers them to stay one step ahead and take prompt and appropriate actions to prevent any compromise of sensitive data.
In addition, the distribution of charging versus not charging devices can be broken down to the organization group level. This granular level of data empowers administrators and operation teams to identify specific stores or locations that might require additional training. This feature becomes especially useful if devices are frequently left off the charger, and it provides a targeted opportunity to address this issue effectively.
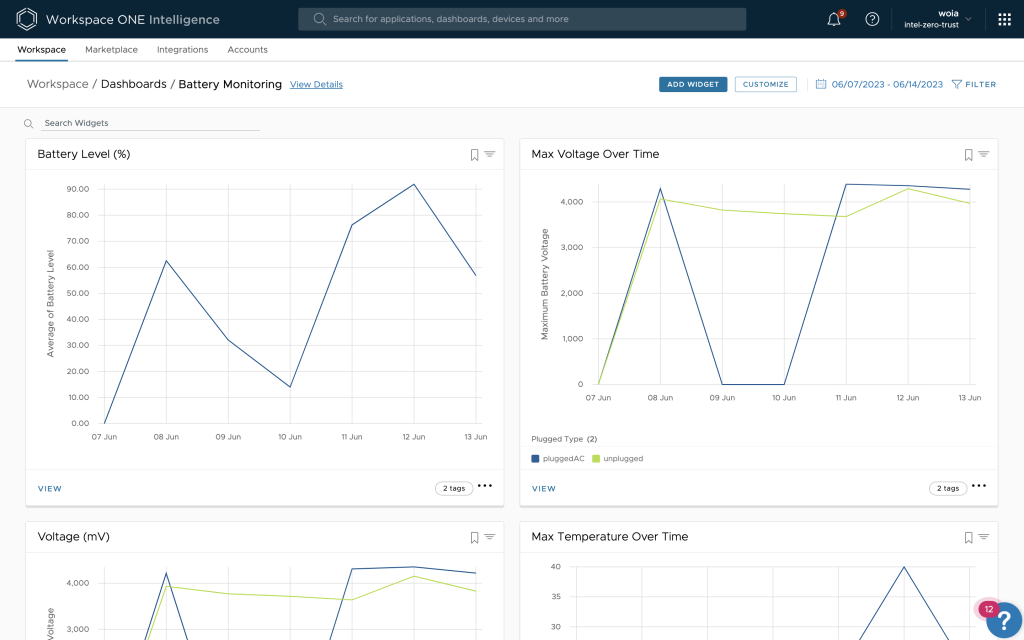
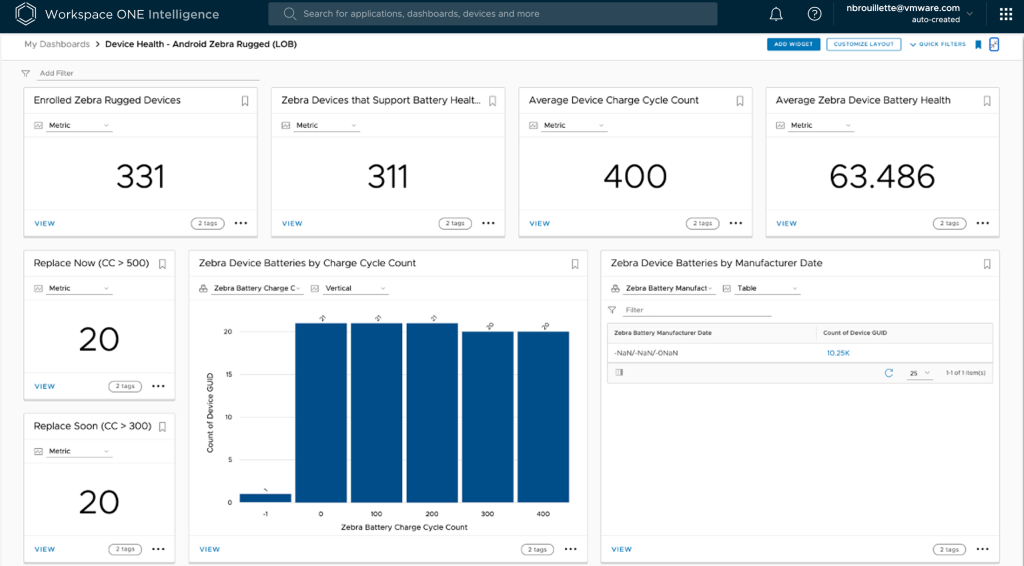
Zebra battery health
The next dashboard template monitors battery health metrics specifically for Zebra devices. Our tailored dashboard consolidates Zebra’s battery health data into a single, easy-to-view location, along with our five other frontline dashboards. The pre-built widgets in this dashboard, such as “replace soon” or “replace now,” are determined by the charge cycle count or Smart Battery Health. This feature reduces the risk of employee downtime by allowing admins to identify and replace batteries prior to any technical difficulties occurring, ultimately improving users’ Digital Employee Experience (DEX) by enabling operations to continue without skipping a beat. Each of these widgets can be tailored to a specific customized threshold. This customization allows for the creation of automated workflows, such as procuring replacement parts or opening service desk tickets for battery replacements, which are triggered by the chosen filters. Furthermore, this dashboard also captures additional details of the Zebra batteries, such as part numbers and manufacture date.
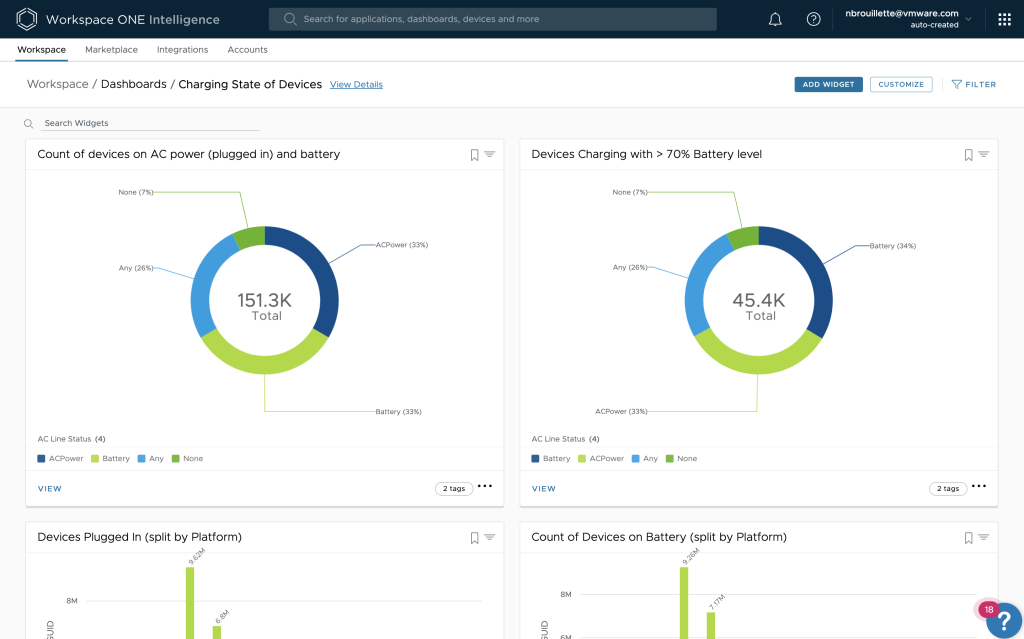
Charging state of devices
This dashboard template assists administrators who support frontline devices to determine the distribution within their device fleet. It distinguishes between devices that are actively charging versus those on battery power across platforms, providing administrators and floor managers visibility to devices that are potentially lost, stolen, or require technical support or repair. This information is derived from tracking the checked-out status and whether the device is charging when checked back in.
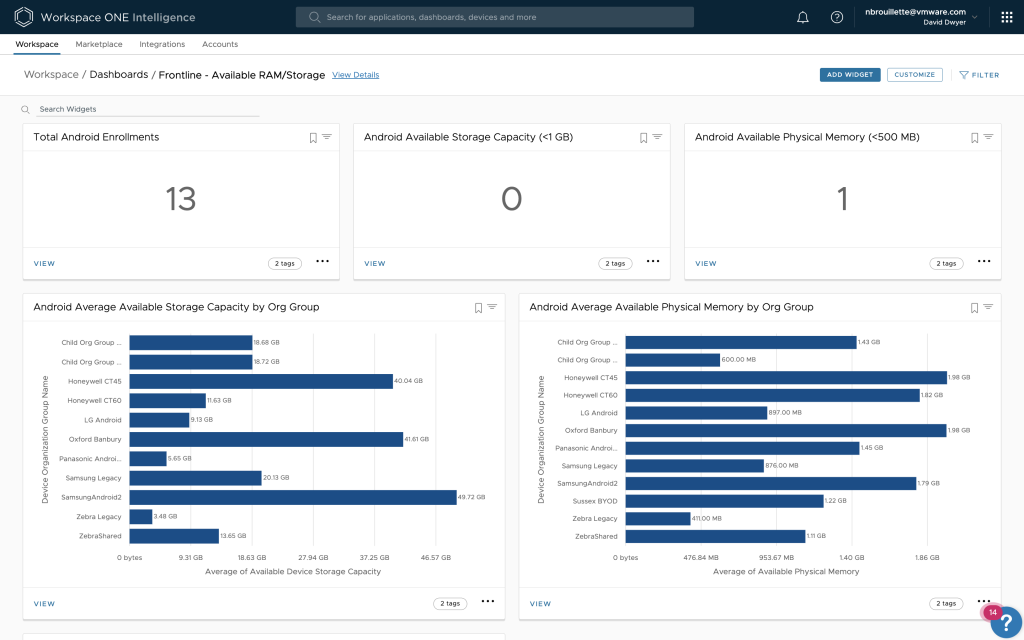
Available RAM/storage
The final dashboard template tracks available memory and storage for frontline devices. This is critical for use cases such as product provisioning, where large files or apps are distributed to devices, such as inventory data or firmware updates. This capability enables IT administrators to identify at-risk devices due to low storage or memory. Recognizing such devices is crucial because insufficient memory can lead to device malfunctions or hinder access to essential work-related content. The IT administrator can further monitor these devices by specific organization groups, which may be structured by store or warehouse. Additionally, if your deployment utilizes tags or alternative methods for device organization, the filtering can be adjusted accordingly.
And there you have it! These are the six frontline dashboard templates available today. To see some of these dashboards in action, you can check out Christina Minihan’s video.
We are excited to say that our teams will continue to add more frontline-specific dashboard templates to meet different deployment needs in upcoming releases. Which metrics would you like to see pre-built into a template next? We want to hear from you! You can post your suggestions and any dashboard template proposals on our ideas page (choose the “Workspace ONE Marketplace” workspace).
To learn more, check out the resources below or contact your VMware sales representative.
- VMware Workspace ONE Intelligence product page
- Empower Frontline Workers Solution Architecture Tech Zone page
- VMware Explore 2023 on-demand video session: “How to Leverage DEX Tools to Optimize Your Frontline Business”
- On-demand webinar: “Optimize Your Frontline Workers’ Device Deployments with Insights, Analytics, and Automation”


