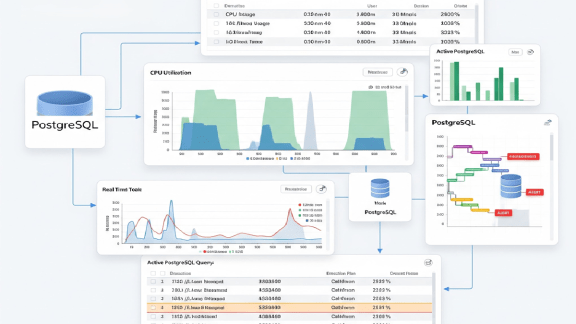

Every database practitioner knows the dread of the classic “black box” window. An application response time spikes, a critical service slows to a crawl, and the classic cross-team finger-pointing begins. As a DBA or platform engineer, you are suddenly responsible for finding the missing piece of the puzzle. You will have to look through broken logs, analyze query plans, and try to figure out what went wrong after the anomaly has happened.
Historically, managing open-source databases on-premises meant sacrificing the rich, built-in observability suites native to public cloud alternatives. You either cobbled together a fragile framework of open-source monitoring agents, or you operated in the dark.
With the release of VMware Data Services Manager (DSM) 9.1 on VMware Cloud Foundation (VCF) 9.1, the data layer gets a massive visibility injection. By introducing native, advanced diagnostic tools built specifically for PostgreSQL 17, DSM 9.1 equips practitioners with the diagnostic superpowers needed to identify and resolve query bottlenecks in minutes, not days.
Here is a technical look at how DSM 9.1 shines a light into your PostgreSQL estates.
Technical Performance and Insight Highlights
1. Advanced Diagnostics Tailored for PostgreSQL
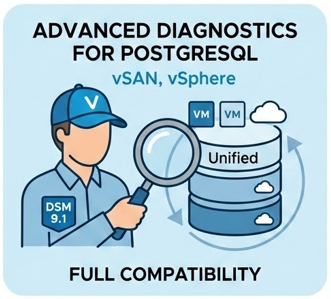
DSM 9.1 provides full compatibility with PostgreSQL, alongside highly granular diagnostic capabilities explicitly engineered for enterprise PostgreSQL environments. Rather than forcing you to jump between independent host metrics and database telemetry, DSM unifies the stack. Practitioners can correlate physical infrastructure anomalies (like vSAN storage latency or vSphere CPU throttling) directly with database engine performance. This single-pane-of-glass view completely eliminates the “infrastructure vs. database” guessing game during root-cause analysis.
2. Time-Travel Triage: The Metrics History View
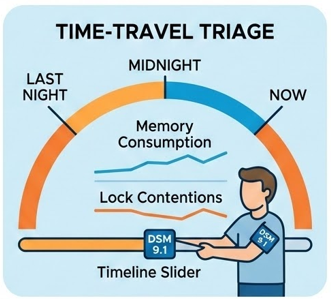
Spotting a spike in real-time is easy; diagnosing a bottleneck that occurred during a batch job last midnight is where replication fails. DSM 9.1 introduces an enhanced Metrics History View that allows users to define custom time ranges to explore historical performance and database health metrics.
Practitioner Impact: This allows DBAs to perform precise trend analysis and backward-looking root cause investigations. You can visually trace memory consumption, active connection counts, and lock contentions across a historical timeline to pinpoint the exact moment query degradation began.
3. Granular Alert Routing with Multi-Watcher Endpoints
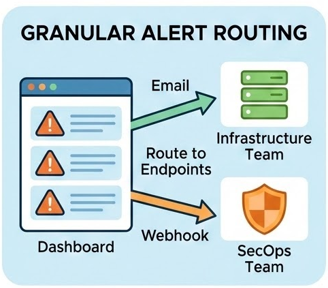
Generic, noisy email alerts are the fastest path to alert fatigue. DSM 9.1 completely overhauls its alerting mechanism with a dedicated Notification tab within the Database Monitoring UI.
Instead of a single global destination for database alerts, you can now configure multiple independent watchers per database. Each watcher can be mapped to its own unique email destination or webhook endpoint.
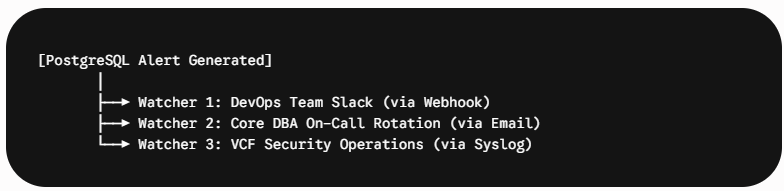
This ensures that a warning about a storage capacity threshold pings the infrastructure team via a webhook, while an anomalous authentication spike is routed directly to the SecOps team.
4. Per-DB Traceability: Expanded Audit Log Forwarding
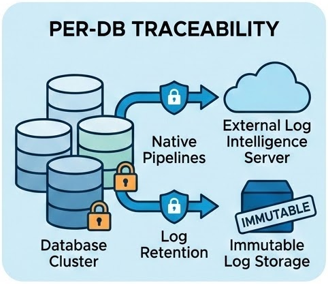
In highly regulated environments, local log retention on the database appliance is a major compliance risk. DSM 9.1 expands enterprise security by allowing database audit logs to be forwarded natively to external log intelligence servers. This feature provides per-database traceability across your entire hybrid cloud footprint, giving security teams a transparent, immutable record of database access and administrative actions without impacting engine performance.
Hardened Security for Practitioner Workflows
Observability is nothing without an ironclad security posture. To ensure that your deep diagnostic capabilities don’t open new risk vectors, DSM 9.1 embeds strict data protection safeguards natively into the deployment workflow:
- Certificate-Based Authentication: Move beyond vulnerable static passwords. DSM 9.1 natively enforces certificate-based authentication mechanisms for PostgreSQL deployments, establishing tight cryptographic access controls over who – and what application – can query your data assets.
- Governed Isolation with Root Access: DSM 9.1 beautifully abstracts away underlying platform and Kubernetes complexities while ensuring technical practitioners retain the tools they need. DevOps teams and DBAs maintain direct, authenticated kubectl access, granting you the power to run low-level configurations within strict IT-defined guardrails.
Shifting Focus from Maintenance to Optimization
At the end of the day, deep visibility is an operational multiplier. By automating the routine manual labor of performance monitoring, log aggregation, and alert configurations, DSM 9.1 drives an average 75% productivity gain for Day 2 operations.
Instead of spending your day babysitting environments, chasing configuration drift, or guessing at query bottlenecks, DSM 9.1 gives you the diagnostic toolkit to act as a true data architect. You can improve query speed, manage large database environments at scale, and ensure your private cloud infrastructure runs smoothly.
The era of the database black box on-premises is over.
The path forward is transparent, performant, and unified.
Discover more from VMware Cloud Foundation (VCF) Blog
Subscribe to get the latest posts sent to your email.