

Introduction
Very often I receive questions like this: “SQL Server takes whatever memory is available, but what does it needs without compromising performance? What metrics to best look at that reflects what a SQL Server needs on a VM regarding memory?” Very valid question, however, not the one that could be answered straight away.
The post below guides you through the usage of the memory resource by Microsoft SQL Server (SQL Server) and how we should approach the monitoring and rightsizing memory for SQL Server on VMware vSphere on in VMware powered cloud (like VMware Cloud on AWS)
Note: For the purpose of this posts we are discussing SQL server installations on Windows Server Guest OS.
Rightsizing Memory for SQL Server and why it’s important
Before digging into technical details, it’s a worthwhile to cite the following document: “One of the primary design goals of all database software is to minimize disk I/O because disk reads and writes are among the most resource-intensive operations. SQL Server builds a buffer pool in memory to hold pages read from the database. Therefore, we should use the most possible amount of memory to have a good performance on cache”. Read this carefully – we are dealing here with the software specially build to use as much memory as possible! And not only this – by adding more memory to SQL Server engine we can possibly reduce disk I/O and, sometimes underestimated, reduce the CPU usage as well. Each and every disk operations not only cause disk I/O, it also requires a CPU cycle to execute. All of this might significantly raise the performance of your database.
From other hands, it’s common to see oversized instances of SQL Server just consuming expensive resources and not being utilize at all. The main goal of your “scientific investigation” while rightsizing SQL Server memory should be to find the right balance between the optimal performance and the resources waste. Let us start with getting an understanding how the memory resource is utilized by SQL Server in the virtual environment.
SQL Server Memory Resource Management
Rightsizing memory for a VM is not an easy part of the virtualization story, as you for sure are very well aware, especially when it comes to an application having its own memory management like SQL Server. The problem is in the layers of the memory management. Taking an example of a VM with Windows OS hosting SQL Server workloads on vSphere ESXi 7.x. we will face at least the following layers starting from the top: SQL Server Resource Monitor, Windows OS Virtual Memory Monitor (VMM), and ESXi host running a VM word and actually providing the physical memory resource.
SQL Server
SQL Server starting with the version 2005 has its own operating system called SQLOS – “it takes care of memory and buffer management, scheduling, resource governance, exception handling, extended events and IO” as stated in the very recommended resource to read about SQLOS. The SQL Server Database Engine manages assigned memory (either statically defined though min/max memory settings or dynamically) on its own via the Resource Monitor, buffer manager, and other components, without communicating back to operating system, how the memory is consumed (with some exception when dynamic memory is used).
I very recommend reading this excellent page in the official SQL Server documentation for more details.
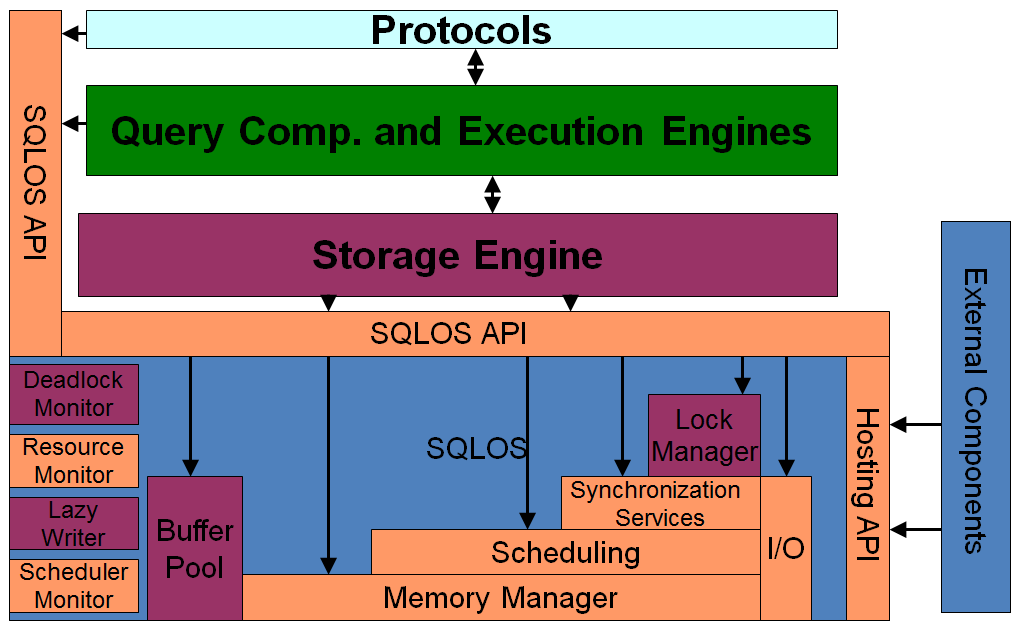
Figure 1. SQLOS Architecture diagram (source: https://blogs.msdn.microsoft.com/sqlosteam/2010/06/23/sqlos-resources/)
Windows OS Virtual Memory Monitor (VMM) is responsible for allocating memory to the SQLOS and is not tracking further how allocated memory is used. Windows Task manager shows the amount of memory used by the process sqlsrv without any further breakdown. This information is not enough to monitor the performance or rightsize memory for SQL Server.
VMware ESXi Memory Counters
VMware ESXi allocates memory upon start of a virtual machine and has no visibility into the real usage of memory assigned to a Guest OS. The counter Memory consumed shows all touched memory blocks and for modern operating systems we’re expecting that the memory consumed will be close to memory allocated +/- 5% (due to the VM memory overhead included in the memory consumed counter).
Memory Active counter shows the statistical sampling of memory blocks being actively touched through the sampling period (based on soft memory faults) and *never should be used* as a performance and/or capacity indicator. the counter measurs the rate of which memory is read or write. Memory is a form of storage. Using a disk analogy, Memory Consumed measures the space used, while Active measures the throughput. They measure 2 different dimensions, and hence are not comparable. This counter was not designed for this purpose. For better understanding of various memory counters I would recommend to review the white paper “Understanding Memory Management in VMware vSphere”.
After reading all above it should be clear: SQL Server native performance metrics are *the only reliable source of the information* for the “real” memory consumption of the database engine. They are available through Distributed Management Views (DMV) under sys.dm_os_memory_XXX and can be easy queried using T-SQL or available in SQL Server specialized monitoring tools. Such tools would normally be used by SQL Server DBAs for a long time, but they are also missing one important layer, not existing in physical environments – memory management done by hypervisor. Even if you rightsized the required memory for the SQL Server engine, while a hypervisor host is experiencing memory contentions or a VM hosting SQL has limits set (do not ever use limits in production environments!). We need to have a tool able to combine both worlds – SQL Server and VMware vSphere.
vROPs and memory rightsizing for SQL Server
Having this important knowledge in mind let us see what we can do with vROPS.
vROPs versions below 6.6.1 without external MPs having no visibility into the Guest OS level and I would not recommend to use memory recommendations for rightsizing or performance troubleshooting *on a VM* level for SQL Server workloads. You still should use memory metrics on the ESXi host level (swapping, ballooning etc) to highlight the memory contention on the host level.
vROps versions 7.0 and later are having some visibility into the Guest OS metrics via VMware tools (versions of VMware tools/ESXi version should be on the recommended level) and the counter “Memory Needed” might be considered as a good counter for general purpose VMs not hosting applications doing its own memory management. Still, as mentioned previously, this information is not enough to rightsize/troubleshoot memory usage of the SQL Server engine itself due to the limitations listed above.
We need to get SQL Server related metrics into vROps. How we can do this:
- Agent-based: vROps with telegraf could be used, however, require installation and maintenance of telegraf agents on your VM with SQL Server software
- Agentless: Management pack for SQL Server (previously, Blue Medora SQL Server Management pack) provides good visibility into SQL Server metrics including the ability to query DMVs and for now is *my recommendation* if a customer want to monitor SQL Server with vROPs. The MP is part of the vROPs Enterprise version.
- Scripting/API: You can create a solution to query DMVs via SQL Server agent and insert data into vROPs via REST API.
Summary
As you can see, the answer to the question: “SQL will take whatever memory is available, but what does it need without compromising performance?” is not an easy one and require aligning of many levels of data. A monitoring solution providing an integral view to all of you components (SQL Server, Windows OS, ESXi host) like vROPS should be considered .
Discover more from VMware Cloud Foundation (VCF) Blog
Subscribe to get the latest posts sent to your email.


