VMware vRealize Operations 6.6 offers many new features. Recently I’ve been covering many of these features in this blog series such as my last two posts – the 5 Must Knows of Automated Workload Balancing with vRealize Operations and the Top 7 Dashboards in vRealize Operations 6.6. In this post, we’ll specifically cover the new Capacity Dashboards in vRealize Operations 6.6.
Capacity management is always of great importance to datacenter managers and administrators as it’s one of the best ways to prevent having to “fight fires” in the datacenter. That’s because by properly managing short-term and long-term infrastructure resource capacity, you can prevent those unexpected performance issues and all the stressful troubleshooting that goes with them (not to mention the performance slowdown and potential outages that these capacity bottlenecks cause for the business and the potential for business-ending impacts that could result).
Thankfully vRealize Operations helps us to monitor short-term and long-term capacity, identify heavy-hitting applications, visualize short-term utilization spikes, and predict long term capacity utilization trends. vRealize Operations 6.6 has more capacity dashboards, across more areas of th infrastructure, than ever before!
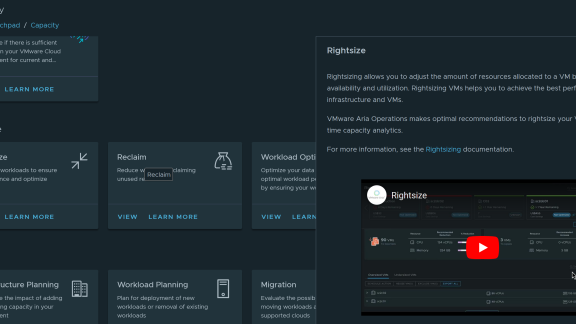
In this screenshot, you can see the partial list of the Capacity and Utilization dashboards available from vRealize Operations 6.6-
In the graphic above you can see that from the Capacity and Utilization dashboards, you can choose from:
- Capacity Overview
- VSAN Capacity Overview
- Capacity Reclaimable
- Cluster Utilization
- Host Utilization
- VM Utilization
- Datastore Utilization (not shown)
- Heavy Hitter VM Utilization (not shown)
How do you access and use each of these different types of capacity dashboards? Let’s find out!
Based on my background as an author of video training content, my favorite way to learn about new technology is through video. I like video because you get to see the technology live / hands-on (even if it is recorded), see how to perform the steps, and see what the response is. I wish that I could say that I’ve created a ton of video content on how to use all of the new capacity dashboards in vROps 6.6… but I haven’t. However, the experts from VMware have created a number of videos on these new dashboards that I want to highlight in this post.
These videos are the fastest way to see the new capacity dashboards in action. Another great way to see these dashboards in action is to use the VMware Hands-On Labs, which give you instant access to a virtual lab environment running vRealize Operations 6.6 so that you can play with these dashboards for yourself.
In the first video below, you’ll get an overview of the new vRealize Operations 6.6 Capacity Dashboard-
In the second video, you’ll learn about the capacity reclaimable dashboard and how it can help you reduce your datacenter TCO.
You should watch the final video to learn about the new vSAN capacity overview dashboard and how it helps you to plan your vSAN capacity for the future
You can download the free trial of the new vRealize Operations 6.6 or try the free vROps 6.6 VMware Hands-On-Lab.
Also, checkout the YouTube PlayList on vROps Dashboards, with over 26 videos on the many Dashboards available in vROps 6.6 !
To learn more about the latest and greatest features in vRealize Operations 6.6, stay tuned to the VMware Cloud Management Blog !


