

Authored By: Tim George, Sr. Technical Marketing Manager, VMware
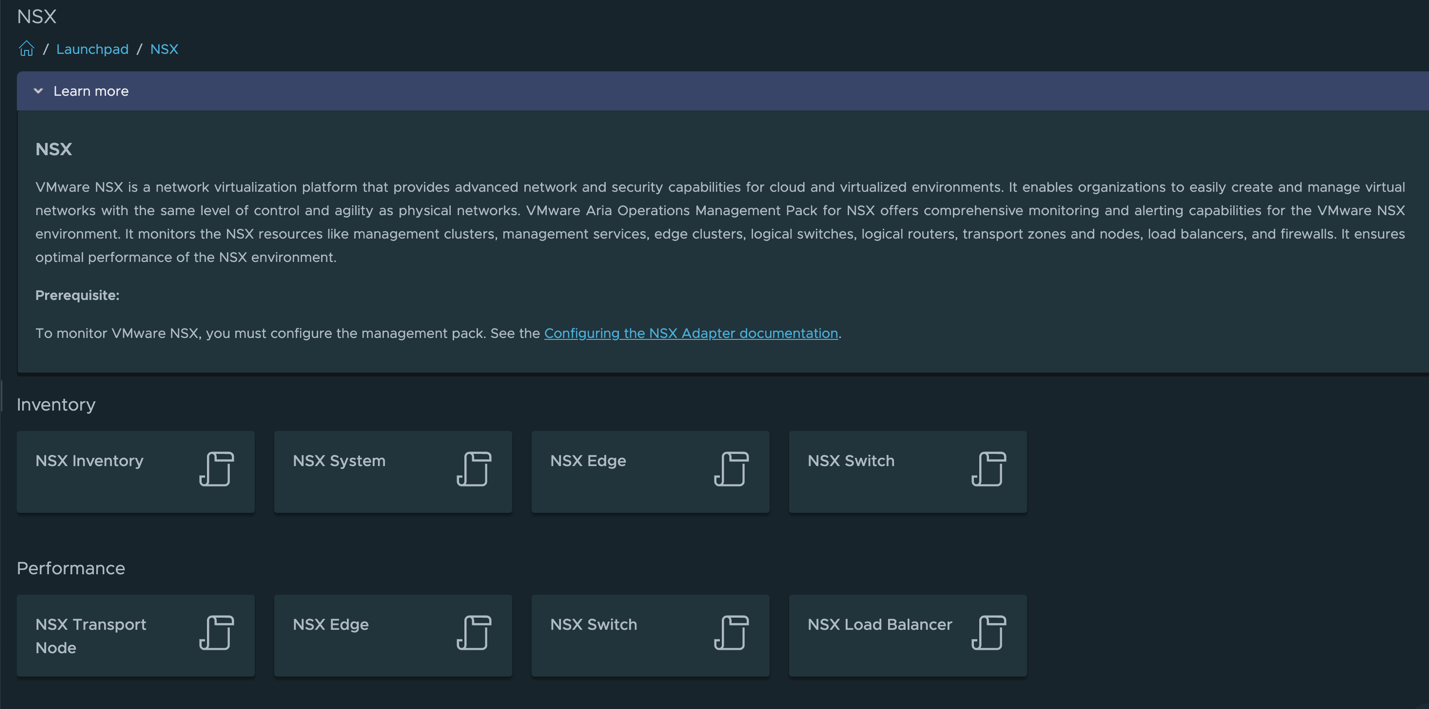
The October release of VMware Aria Operations includes significant improvements in the way we can monitor and check into the performance of NSX. We have added seven new dashboards to the Launchpad that will allow you to quickly access and leverage the valuable insights that these dashboards provide. We will take a look at each dashboard individually as we go on, but the comprehensive list includes the NSX Inventory Dashboard, NSX System Dashboard, NSX Edge Dashboard, NSX Switch Dashboard, NSX Transport Node Performance Dashboard, NSX Edge Performance Dashboard, NSX Switch Performance Dashboard and NSX Load Balancer Performance Dashboard. Each of these dashboards provides its own set of capabilities and specialties.
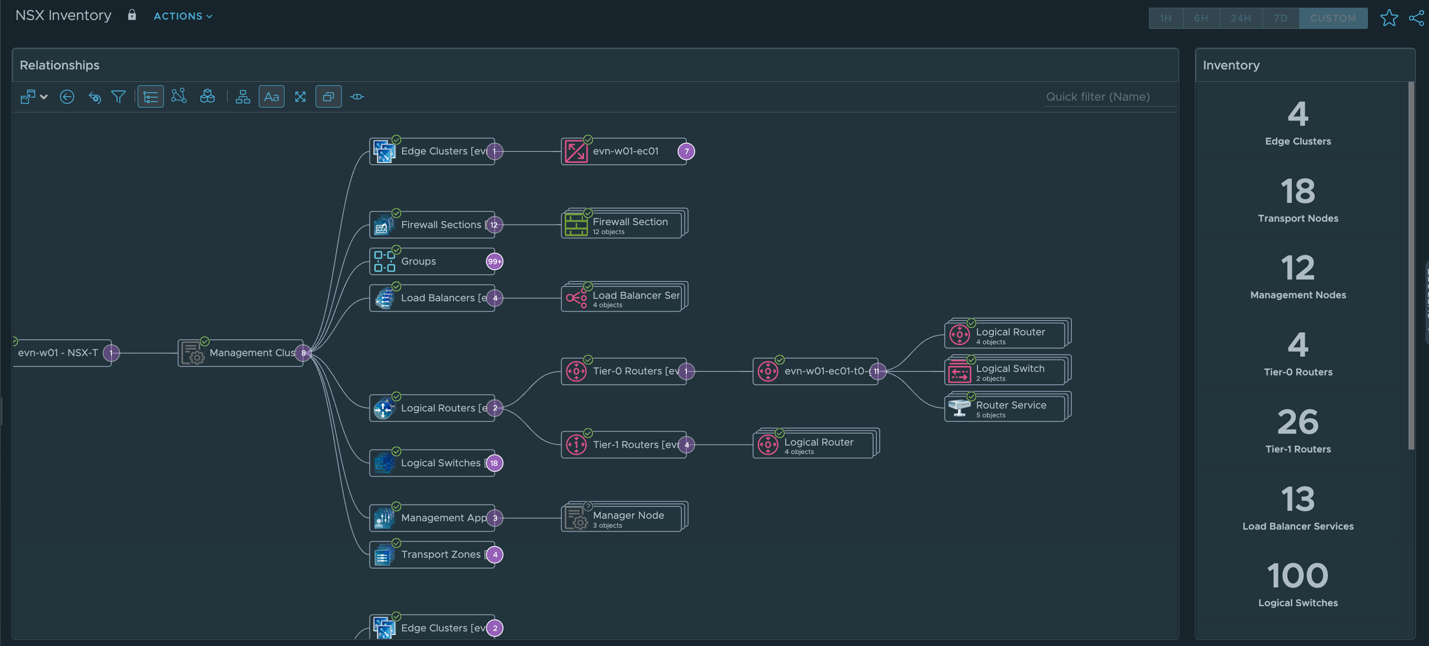
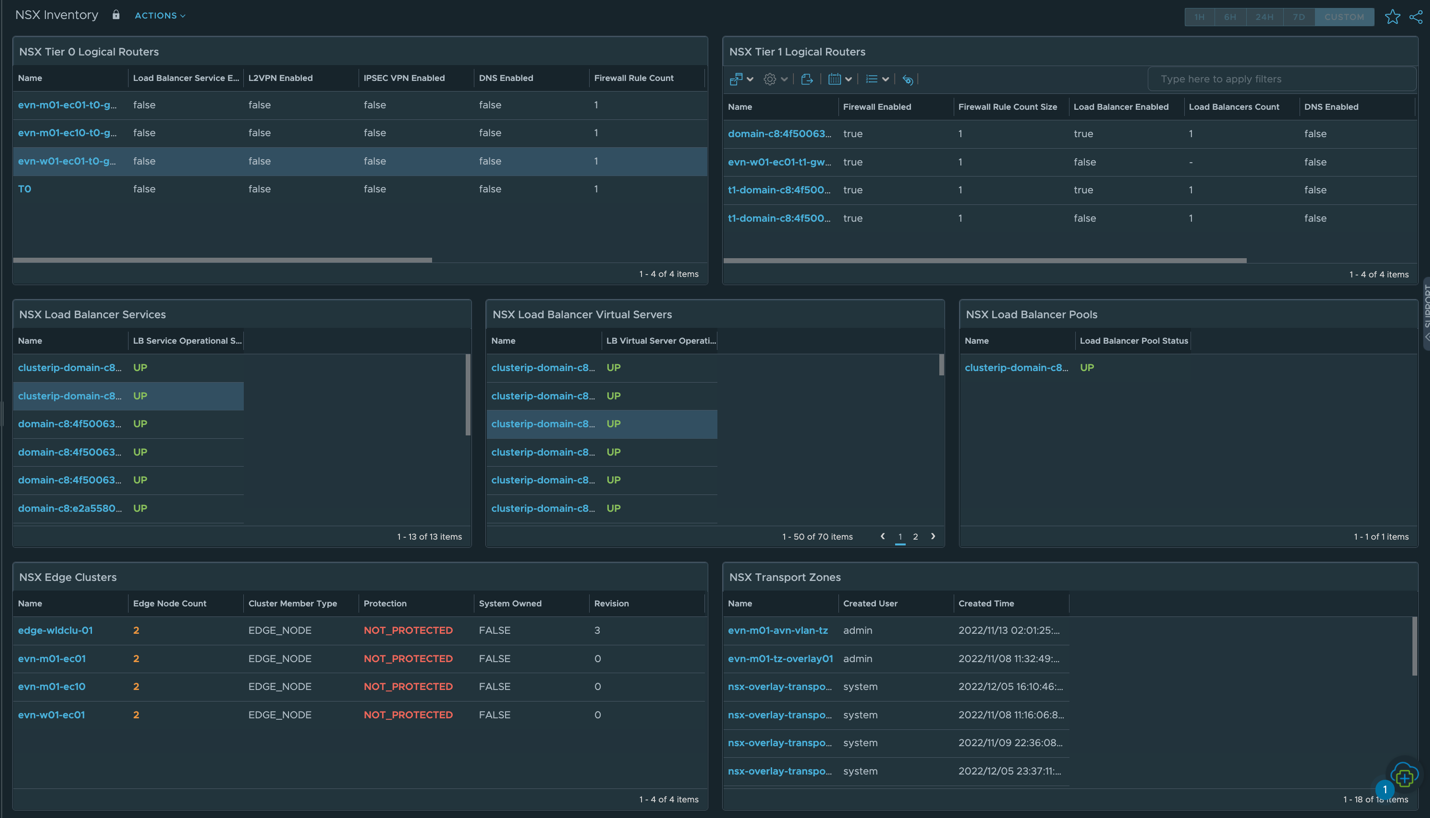
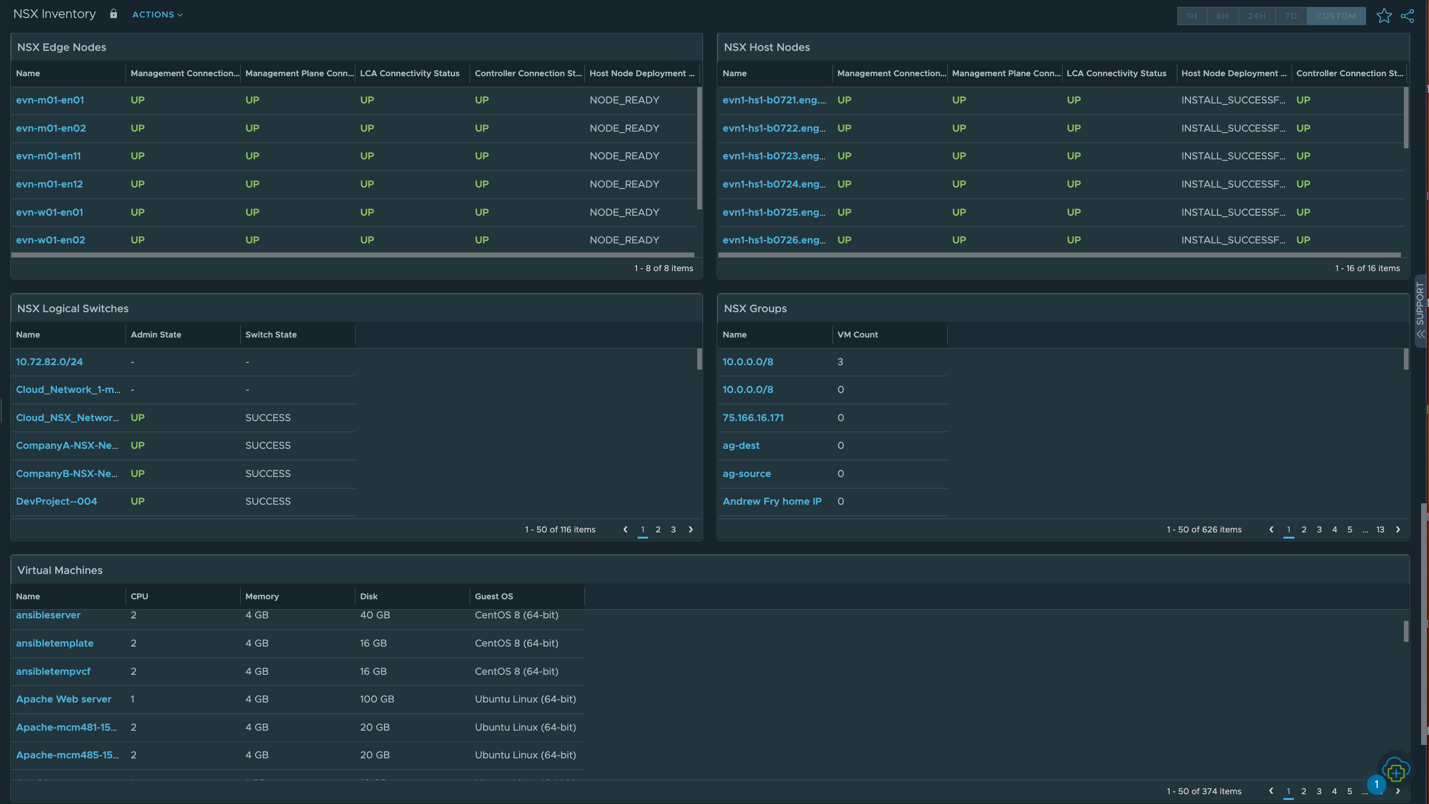
NSX Inventory Dashboard
The NSX Inventory dashboard in VMware Aria Operations provides a holistic view of NSX environment topology. It offers an graphical representation of the interconnections between various NSX components.
This dashboard helps administrators with essential insights into the following components:
- NSX Management Nodes: Displays information related to the status and configuration of NSX management nodes.
- T0 and T1 Routers: Displays details of the t0 and t1 routers including their configurations and associations.
- NSX Load Balancers (LBs) and LB Pools: Displays information about NSX Load Balancers, virtual servers, pool members, and health checks.
- Edge Clusters: Displays data on Edge Clusters including cluster membership and resource consumption.
- Transport Zones: Displays insights into transport zones, offering visibility into network segmentation and connectivity options.
- Edge Nodes and Host Nodes: Monitors Edge Nodes and Host Nodes that are crucial components of the NSX infrastructure.
- Logical Switches: Displays a comprehensive list of logical switches with associated properties and configurations.
- NSX Groups: Displays details related to NSX Security Groups and Service Groups, simplifying group membership and policy management.
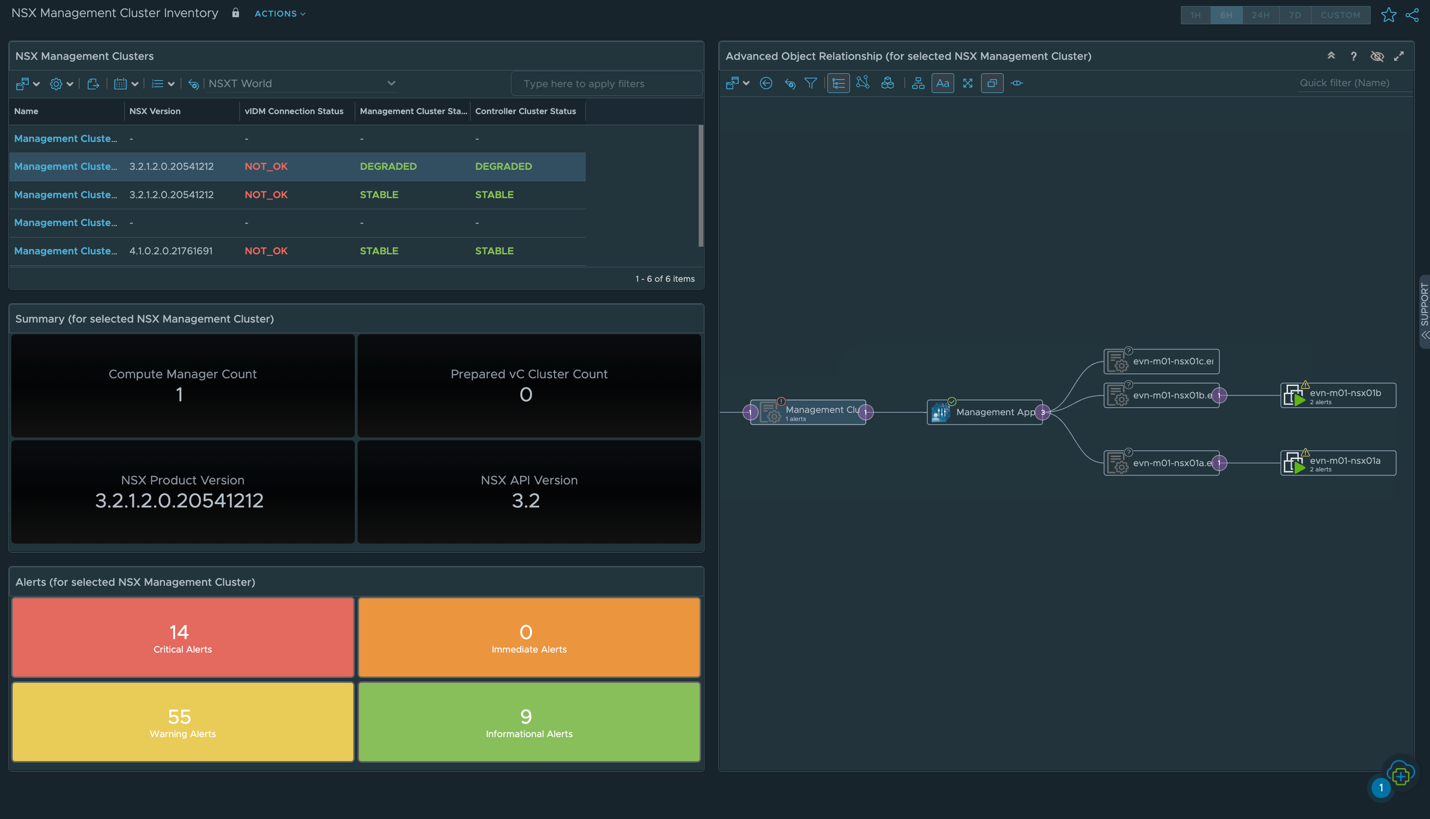
NSX System Dashboard
The NSX System dashboard in VMware Aria Operations provides essential insights into the core components of the NSX infrastructure specific to inventory and health.
This dashboard offers visibility into the following aspects:
- Management Clusters: Displays information about NSX Management Clusters including cluster health, member nodes, and their roles.
- Advanced Object Relationship: This allows you to explore intricate connections between different NSX objects, enhancing your understanding of component interactions.
- Summary: Displays a concise snapshot of the NSX system, presenting key performance metrics and alert notifications.
- Alerts: Monitors and manages alerts generated within the NSX environment, offering insights into critical issues that require attention and resolution.
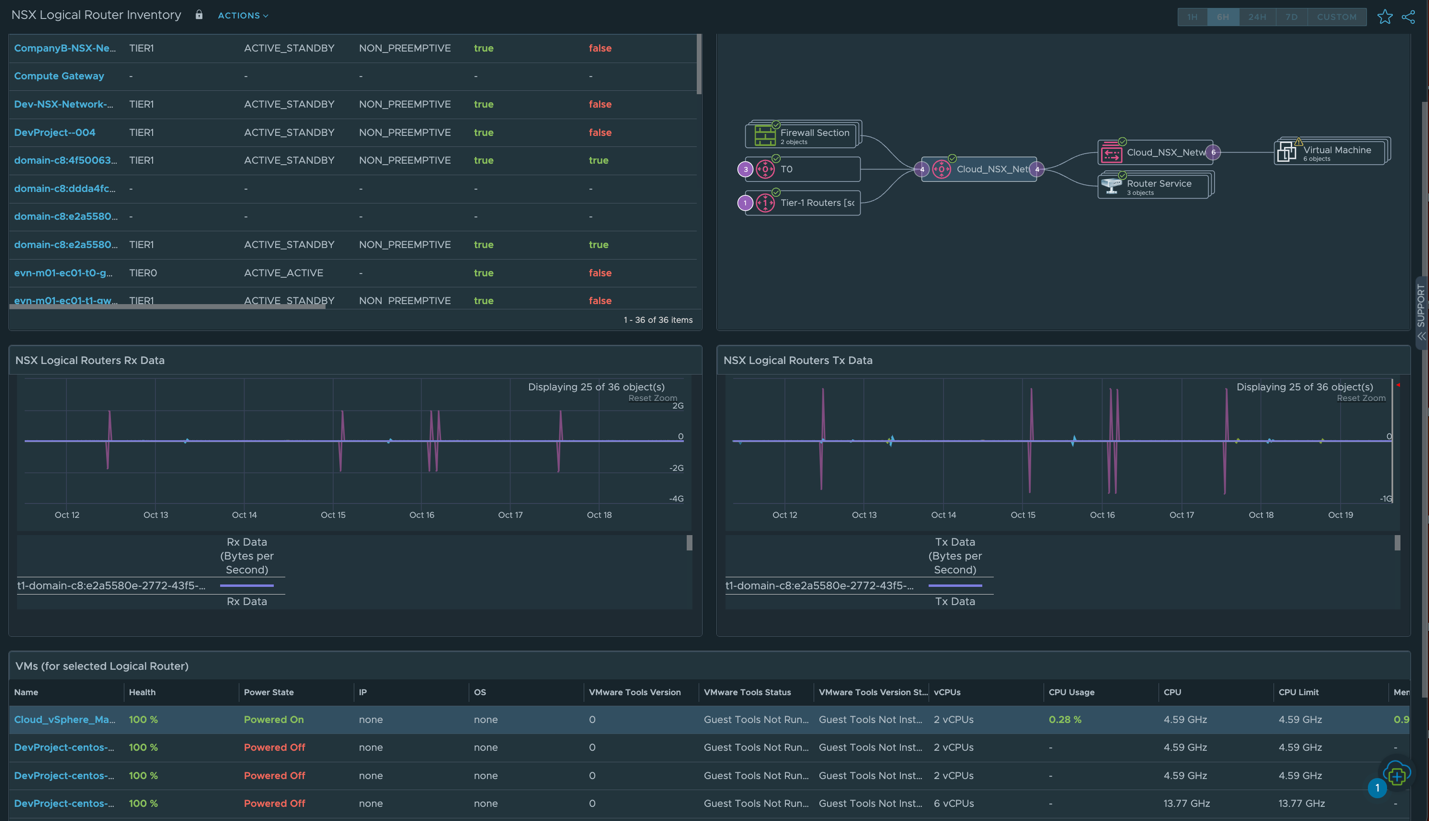
NSX Edge Dashboard
The NSX Edge dashboard in VMware Aria Operations provides detailed insights into the performance and configuration of Logical Routers, which is a foundational component of the NSX Edge environment.
This dashboard equips administrators with the necessary tools to effectively manage, optimize, and troubleshoot the performance of Logical Routers within the NSX Edge environment. This dashboard offers the following features:
- Logical Routers: Displays information related to Logical Routers, including configurations, routing tables, and interface details.
- Advanced Object Relationship for Logical Router: Displays insights into complex relationships specific to logical routers.
- Logical Router RX and TX: Monitors traffic received (RX) and traffic transmitted (TX) by logical routers to optimize network performance and troubleshoot issues.
- VMs Using Logical Router: Identifies virtual machines (VMs) utilizing specific logical routers, offering visibility into network traffic patterns and dependencies.
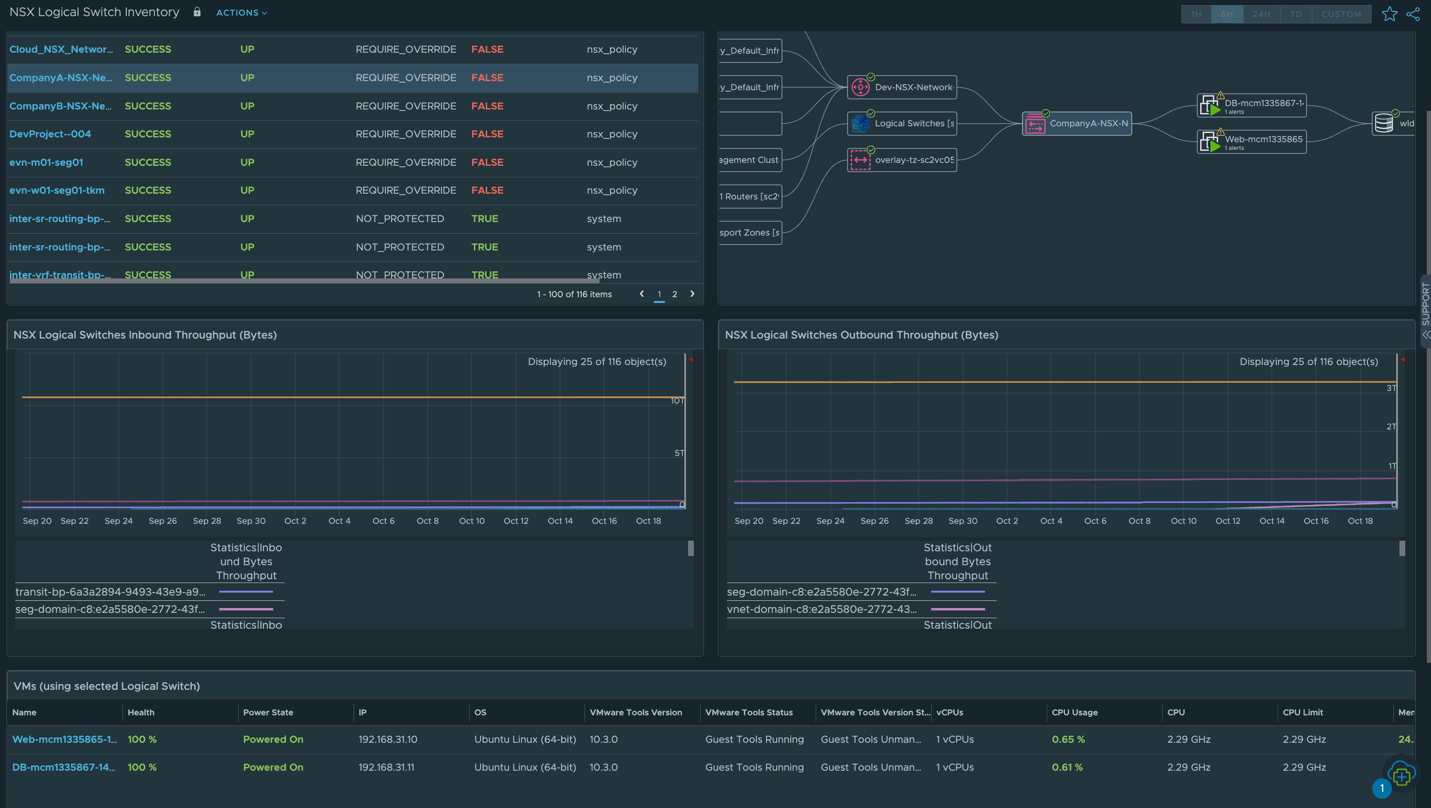
NSX Switch Dashboard
The NSX Switch dashboard in VMware Aria Operations provides information about logical switches. It includes an inventory of logical switches with their associated properties and configurations.
Additionally, the dashboard offers the following functionalities:
- Inventory of Logical Switches: Displays detailed information on logical switches for efficient tracking and management of network segmentation.
- List of NSX Logical Switches: Displays a comprehensive list of NSX logical switches, simplifying the tracking of network segmentation.
- Advanced Object Relationship of Logical Switch: Provides insights into the intricate relationships and dependencies between logical switches and other NSX components.
- Logical Switch Inbound and Outbound Throughput: Monitors inbound and outbound traffic throughput for logical switches to optimize network performance and identify potential bottlenecks.
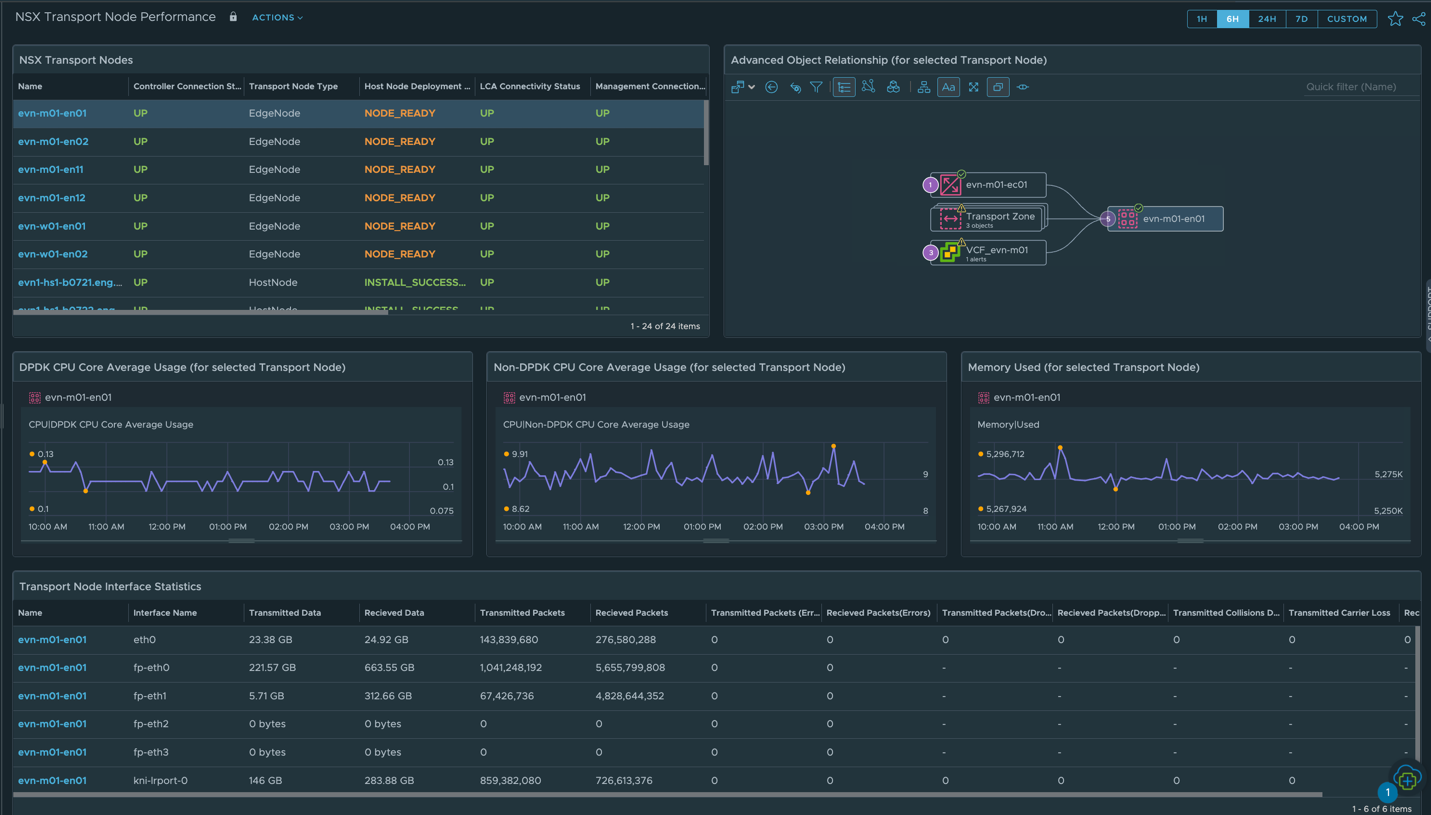
NSX Transport Node Performance Dashboard
The NSX Transport Node Performance dashboard in VMware Aria Operations provides an extensive view of performance metrics related to NSX Transport Nodes. It provides essential insights into the operation and efficiency of these nodes, aiding network administrators in optimizing resource allocation and ensuring seamless data packet forwarding within the NSX environment.
You can monitor the following key metrics:
- DPDK CPU Core Average Usage
- Non-DPDK CPU Core Average Usage
- Memory used for Transport Node
- Transport Node Interface Statistics
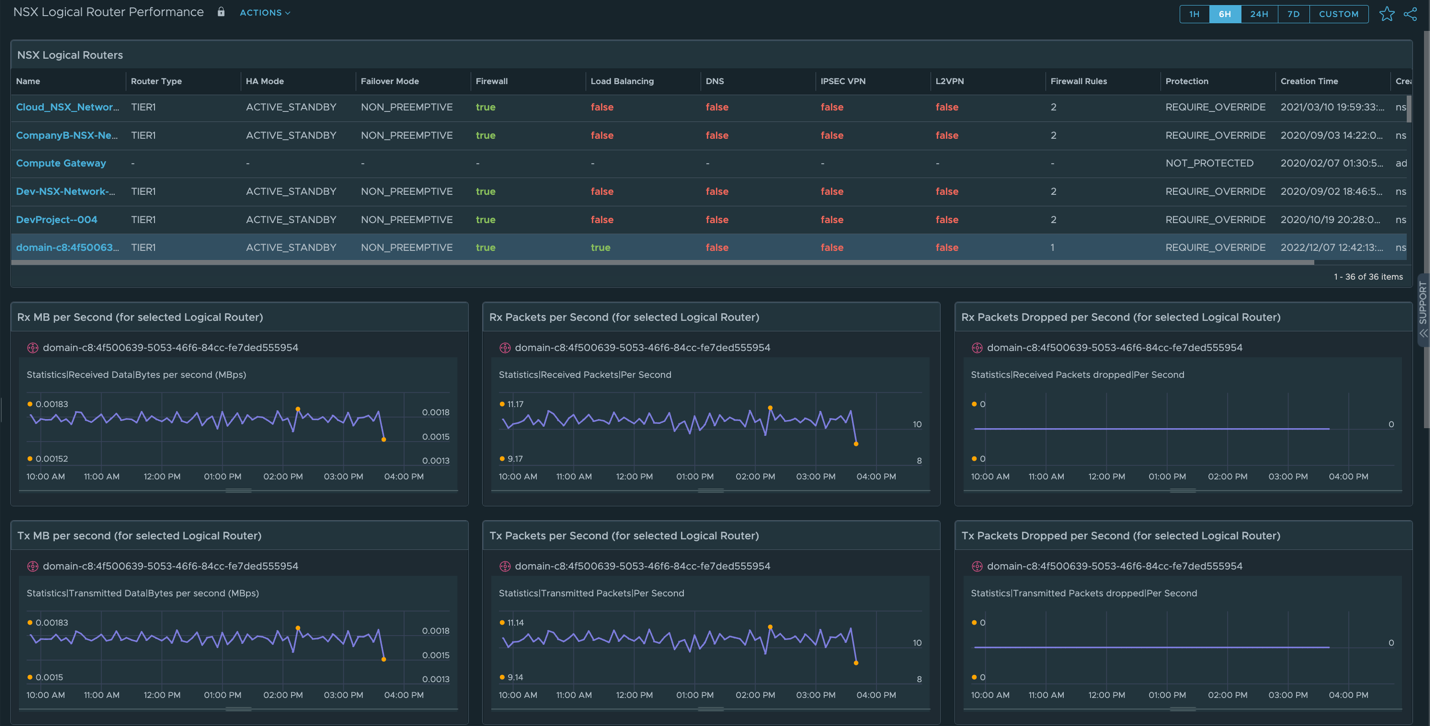
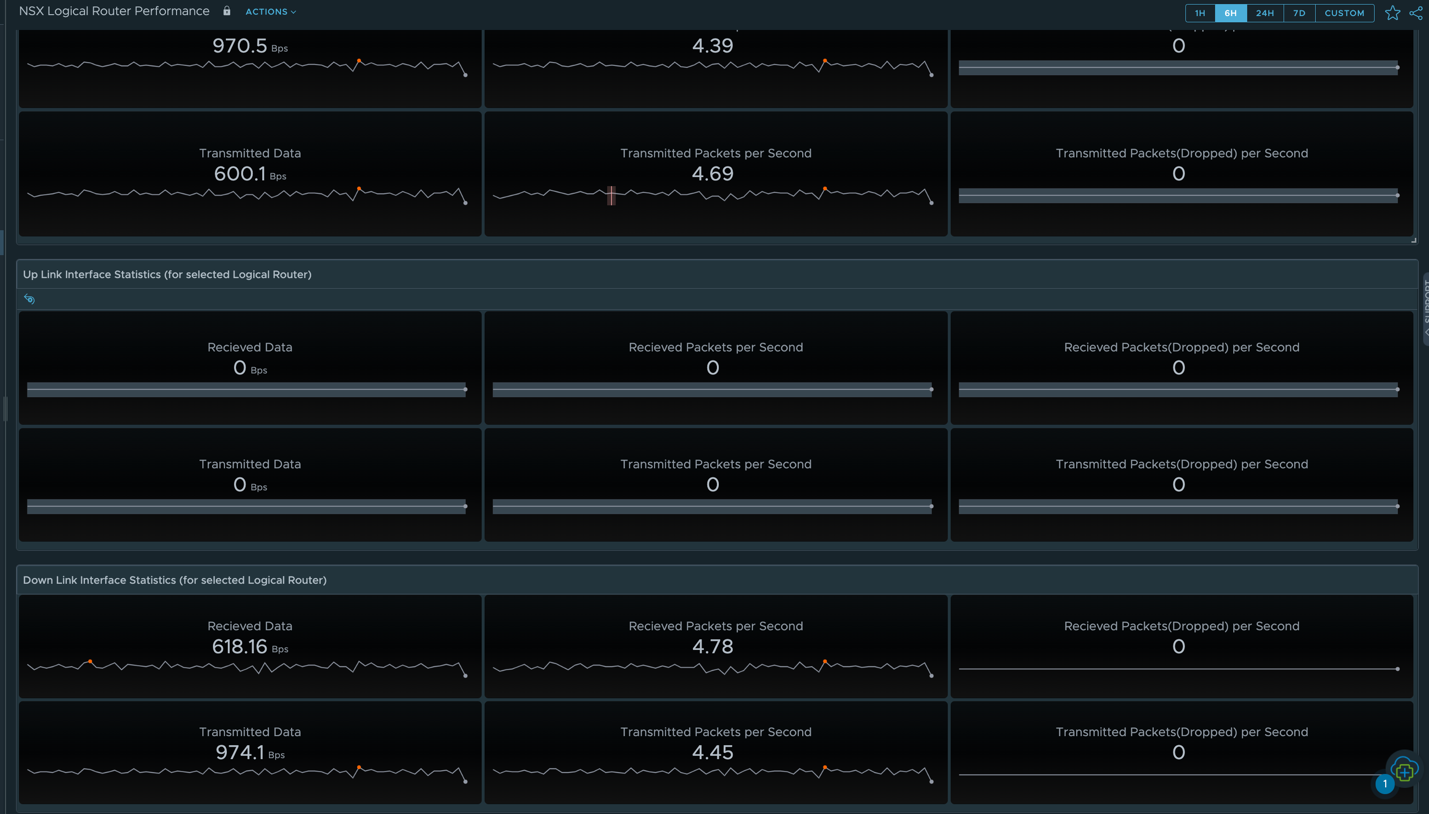
NSX Edge Performance Dashboard
The NSX Edge Performance dashboard in VMware Aria Operations provides performance information on NSX Edge devices. It offers visibility into the operation of these devices, assisting users in maintaining optimal routing and network services while swiftly addressing potential issues.
You can monitor the following key metrics:
- List of NSX Logical Routes
- RX MBPs (Megabits per second)
- TX MBPS (Megabits per second)
- RX Packets Per Second
- TX Packets Per Second
- RX Packets Dropped Per Second
- TX Packets Dropped Per Second
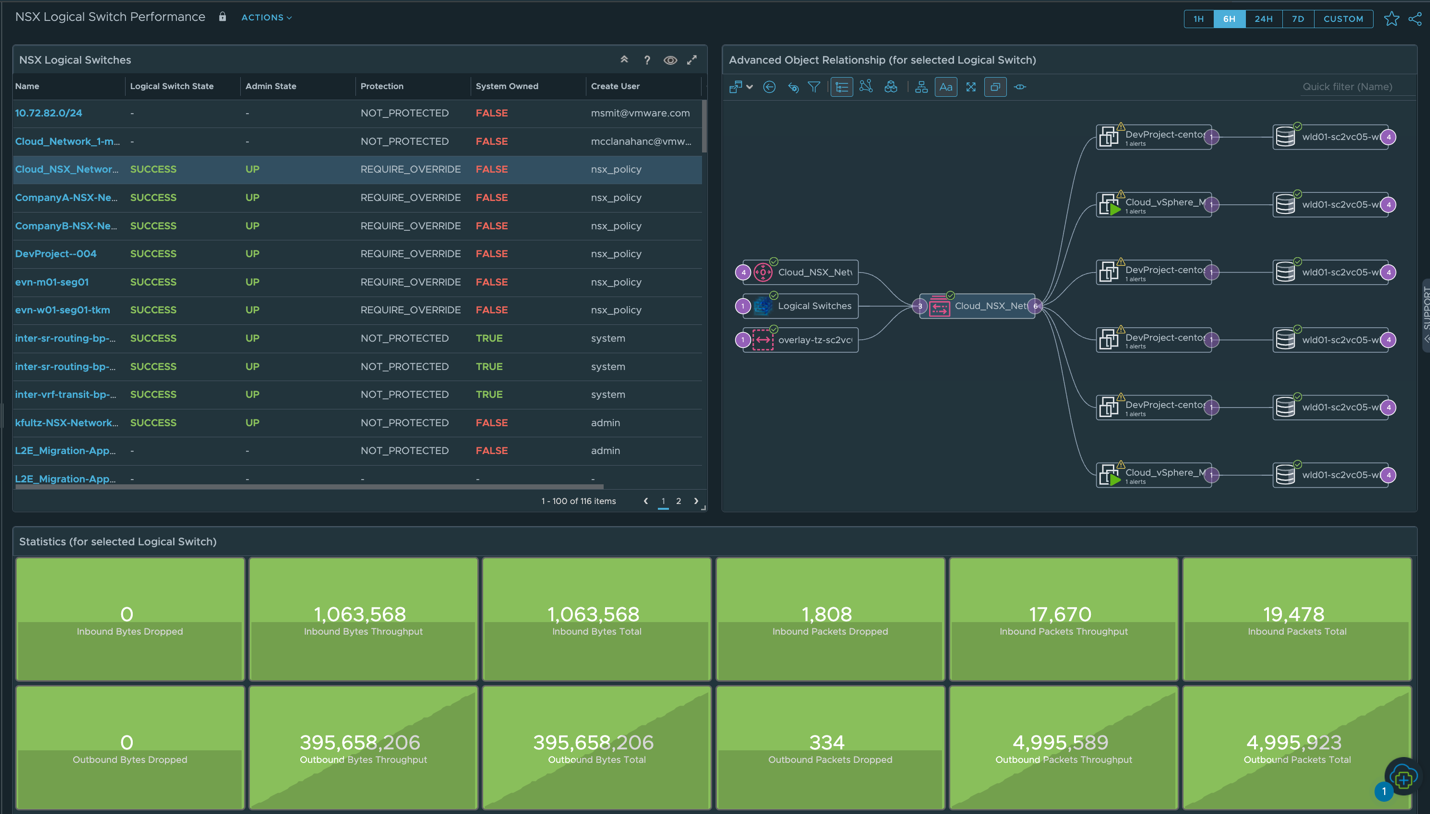
NSX Switch Performance Dashboard
The NSX Switch Performance dashboard in VMware Aria Operations focuses on the performance of logical switches of the NSX environment. It simplifies the tracking and management of network segmentation while offering insights into the dependencies between logical switches and other NSX components.
You can monitor the following key metrics:
- List of NSX Logical Switches
- Advanced Object Relationships
- Performance Statistics (Inbound and Outbound Throughput)
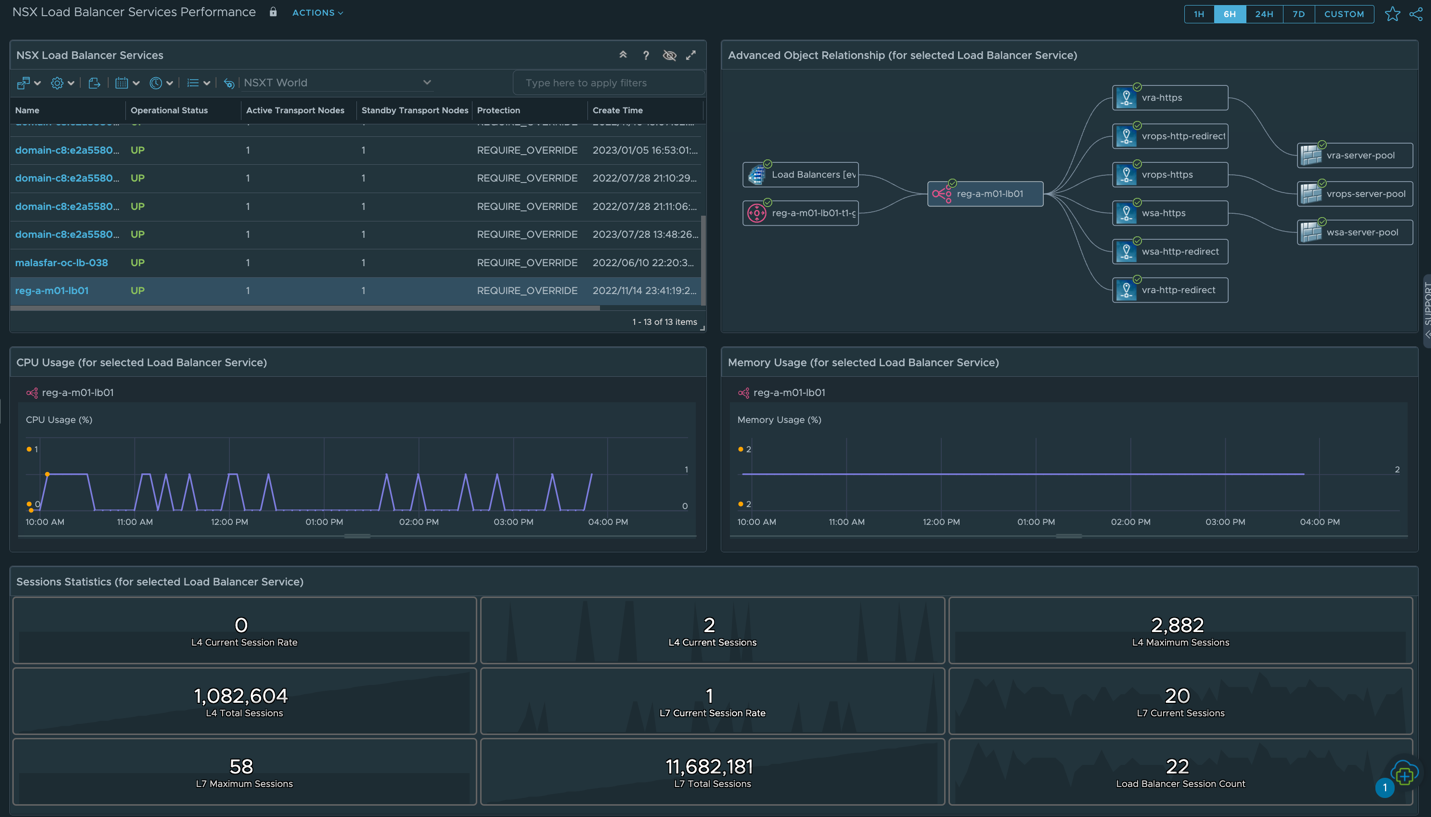
NSX Load Balancer Performance Dashboard
The NSX Load Balance Performance dashboard in VMware Aria Operations offers detailed insights into the performance of NSX Load Balancer services. It includes critical data related to the operation of Load Balancers, providing administrators with the necessary information to optimize configurations and maintain high availability and performance for applications and services.
You can monitor the following key metrics:
- CPU Usage of the Load Balancer
- Memory Usage of the Load Balancer
- Session Statistics
As you can see, much work has gone into these dashboards to ensure that every NSX user has the data that they need in order to keep their virtual networks running like clockwork! To learn more about what was included in this release, check out the Release Notes or our TechZone page to learn more about VMware Aria Operations.
Discover more from VMware Cloud Foundation (VCF) Blog
Subscribe to get the latest posts sent to your email.


