In my last article two articles of this series, I covered Introduction to Capacity Planning from the World View and Capacity Analysis of your vSphere Hosts. As you might have guessed, we are started at the top level (the world view) and drilling down deeper to the host level. Now, in this article, we’ll drill down even further, to the virtual machine level. Of course, there are other levels that you can analyze capacity at, such as the virtual datacenter level, cluster level, and datastore level, however there’s no doubt that host and VM will be the most popular.
So how can you analyze and plan capacity for your vSphere virtual machines using vCenter Operations Manager? Let’s find out.
Virtual Machine Performance and Capacity Dashboard
The dashboard view, for just about every object in vC Ops, is always a great place to start any sort of analysis. As you can see in Figure 1, for the virtual machine selected below, the dashboard view shows us the major badge scores for this VM – health, risk, and efficiency. The scores that you find on the dashboard for your virtual machine are the most immediate indicators as to whether or not you that VM has a capacity issue.
Figure 1 – VM Dashboard
Let’s say that you do see a score that you are concerned about (low health, high risk, or low efficiency), under each of those badges you can click on links that provide you more information such as the “Why is Health 90?”, in Figure 1.
Virtual Machine Environment Tab
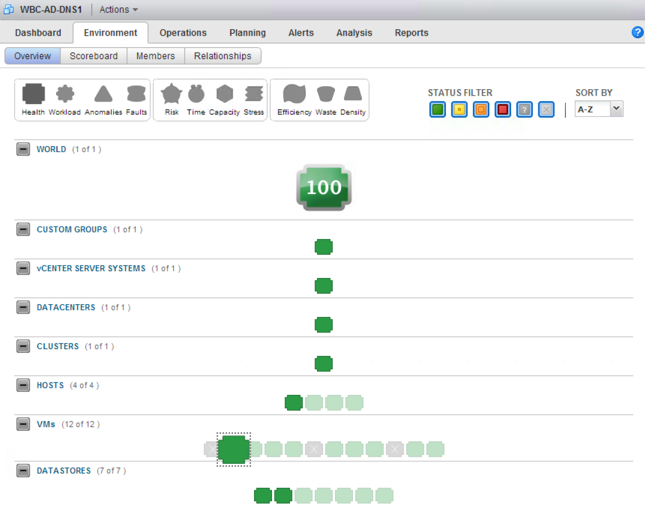
Moving from the Dashboard tab to the right, to the Environment tab, you’ll find four sub-tabs – overview, scoreboard, members, and relationships. The Environment tab allows you to look at the objects in your virtual environment from different perspectives.
The Overview tab gives you a visual representation of your virtual infrastructure so that you can compare the scores of higher level objects to the VM object in order to identify possible cases of performance issues. In the case of this VM, if the VM were red but all objects above were green then there is a problem with the VM itself. However, if the VM were red and the host and related datastore were also red them perhaps you have a host or datastore performance issue to consider.
Figure 2 – VM Environment Overview
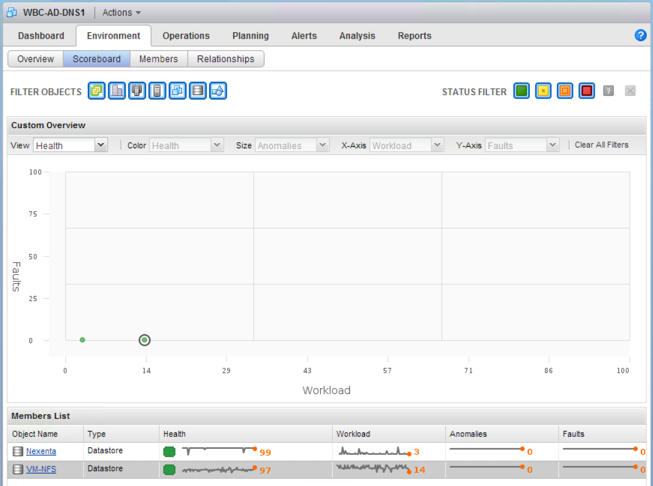
Next under the VM environment is the Scoreboard. The purpose of the Scoreboard tab is to help you view multiple metrics, all at the same time, across multiple related objects, to quickly isolate issues. As virtual machines usually only have relationships to the hosts they run on and the datastores they are stored on, the scoreboard tab may have limited applicability at the lowest level (the VM level).
Figure 3 – VM Environment Scoreboard
My favorite environment tab is the relationships tab (Figure 4), where you’ll get a visual depiction of how this VM relates to the host and datastores that it runs on, which can be useful in understanding the infrastructure you are working in.
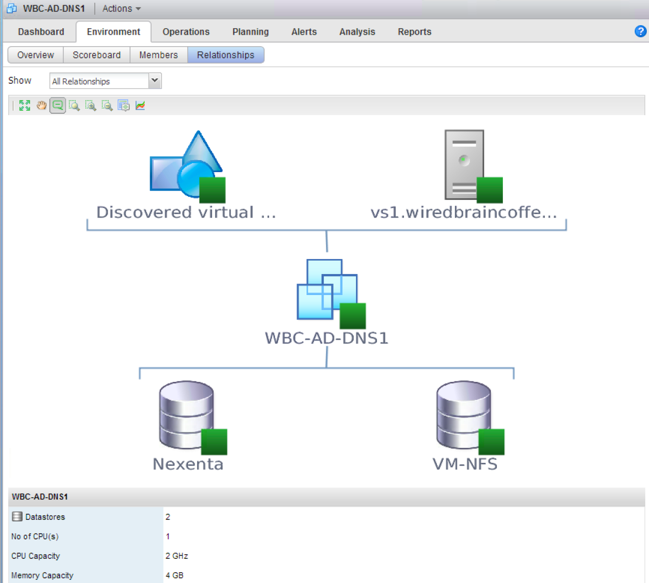
Figure 4 – VM Environment Relationships tab
Virtual Machine Operations Tab
When it comes to performance and capacity analysis, I think my favorite set of tabs is the Operations tab. It’s here that you’ll find operational details, events, and metrics.
As you see in Figure 5 below, this is where you’ll find out what makes up your health score. Is it CPU, memory, disk I/O, or network I/O that might be causing your performance or capacity issue?
Figure 5 – VM Operations Details tab
And then, if you do have a VM performance issue, what events have happened that might have caused the issue? The Operations / Events tab is where you’ll find the correlation between a potential performance issue and an event that has happened to this virtual machine. For example, did the VM recently move to a new datastore or host?
Figure 6 – VM Operations Events tab
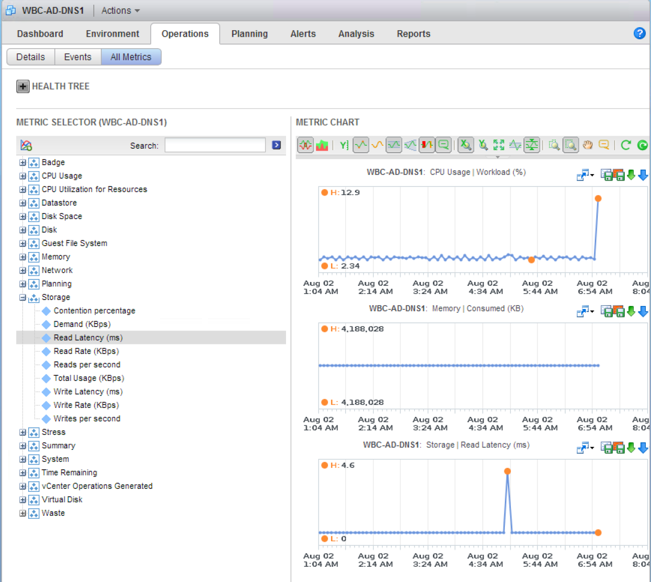
The Operations / All Metrics tab provides is the ultimate detail that allow you to dig deep into performance and vC Ops badge metrics to truly identify the cause of a performance issue, as it relates to a virtual machine.
Figure 7 – VM Operations – All Metrics
Virtual Machine Planning Tab
If you don’t have an immediate performance issue to deal with but instead just need to do some long-term planning for a virtual machine, the VM Planning tab is the place to go. It offers sub-tabs, Summary, Views, and Events.
In Figure 8 below, you see the VM Planning / Summary tab. It’s here that you can answer critical questions about VM capacity utilization, for the long run. For example, you’ll be able to answer questions like:
- How long until this VM is out of CPU capacity?
- When will this VM run out of memory?
- When will this VM run out of disk capacity or read/write throughput?
- (and much more)
Figure 8 – VM Operations – Planning Summary
The Planning Views sub-tab provides some really excellent graphs related to VM CPU, memory, and disk I/O utilization (Figure 9).
Figure 9 – VM Operations – Planning Views
Virtual Machine Alerts and Analysis Tabs
So how do you know if there is a problem with a VM? Any active alerts about a virtual machine will be found in the Alerts tab. It’s here that you’ll be able to actively see if vC Ops thinks there is a problem with a VM, what level of severity vC Ops assigns to that problem, and what the cause of the problem is.
Figure 10 – Virtual Machine Alerts
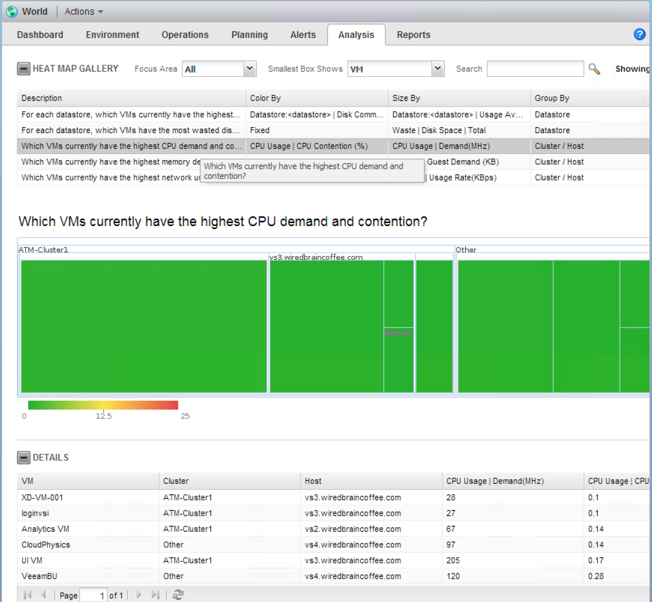
Finally, the Analysis tab is where you go to find out about VM contention. It will help you to answer questions like:
- Which VMs on a datastore have the highest I/O utilization
- Which VMs have the highest memory demand, network demand, and more
Figure 11 – Virtual Machine Analysis Tab
Summary
After reading this article, you should know where to go if you have an immediate vSphere virtual machine performance / capacity issue to solve. While all the different tabs provide assistance, the Dashboard tab, Operations Details and Operations All Metrics tabs, the Planning Summary and Planning Views tabs, and the Analysis tabs all provide a wealth of information that you can use to quickly solve performance issues with your vSphere virtual machines.
Questions or comments? Please post them below.
Stay tuned for more great real-world, first-hand knowledge about VMware vCenter Operations Manager!


