

As announced at VMware Explore, Tanzu Data Intelligence enables organizations to better unify, analyze, and activate all their data at scale, across clouds, teams, and use cases. It provides real-time access and supports AI and agentic solutions, enabling more intelligent automation and adaptive experiences. By moving beyond batch processing, it can drive faster, more responsive insights across the business.
VMware Tanzu Data Flow and VMware Tanzu GemFire are two key components that help bring this kind of data platform to life. Tanzu Data Flow orchestrates real-time data pipelines, while GemFire delivers low-latency, high-throughput access to operational data. Together, they support the shift from batch to real time, enabling more intelligent, responsive systems.
How Tanzu Data Flow and Tanzu GemFire help you build dashboards that keep up with your business
In most companies, dashboards lie. Not maliciously, of course, but by the time a chart updates or a metric refreshes, the underlying event may be long over.
That’s because many dashboards are powered by data pipelines built on batch cycles. Data is extracted from systems, loaded into databases, transformed, and then visualized, every 15 minutes, once an hour, or worse. It’s a system designed for historical reporting, not real-time decision making.
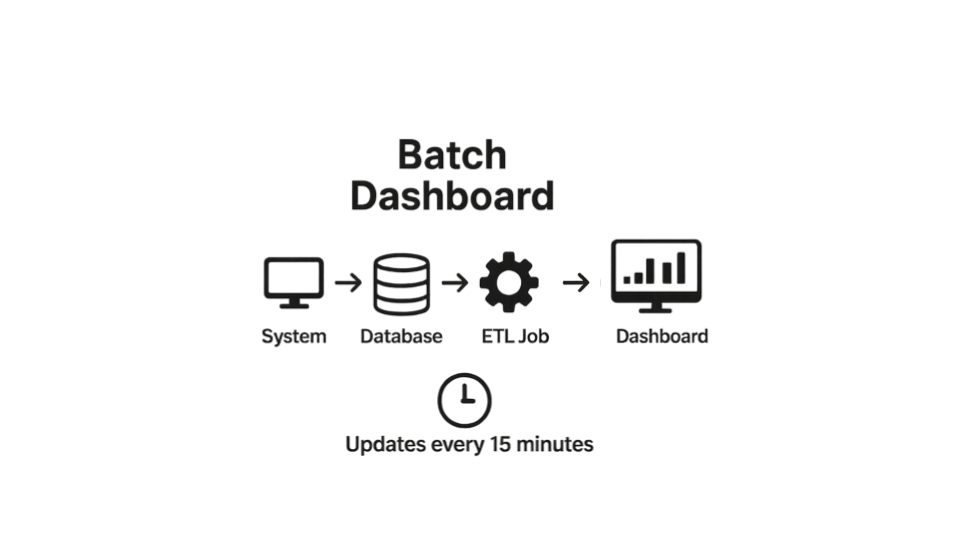
Fig 1. Batch dashboard workflow
But there are many cases where this cycle won’t cut it:
- Not every business runs on 15-minute cycles.
- Insight is often needed right now, not hours, days, or weeks later.
- The people closest to the data don’t always have time to wait for developers to push back-end changes.
This is where Tanzu Data Flow and Tanzu GemFire can help. Together, they unlock a model of self-service, low-code, real-time data infrastructure that better keeps up with the pace of your business.
From ticket to deployment: Why dashboards take too long
We’ve all been there.
It starts with a simple request.
Marketing wants to track a new campaign metric. A product analyst needs a better view of customer segments. Operations needs to monitor fulfillment in a region that just came online.
The ask goes to engineering. The back-end team might need to expose a new API or stream. That gets scoped into a sprint. Then it’s tested, staged, deployed, and maybe the dashboard gets updated.
By the time the metric shows up, the moment has passed. Or worse, the data is incorrect or incomplete and no one’s quite sure why. This process can work when data is static and changes slowly. But modern systems like e-commerce platforms, logistics pipelines, and fraud detection engines operate in real time. There’s no time to wait for the next batch job.
Dashboards need to reflect what’s happening now. That means connecting to event streams, not just data warehouses. It means reacting to live events, not polling for stale snapshots. It also means giving the people who know the business the tools to build and iterate without writing code.
That’s exactly what Tanzu Data Flow and Tanzu GemFire can make possible.
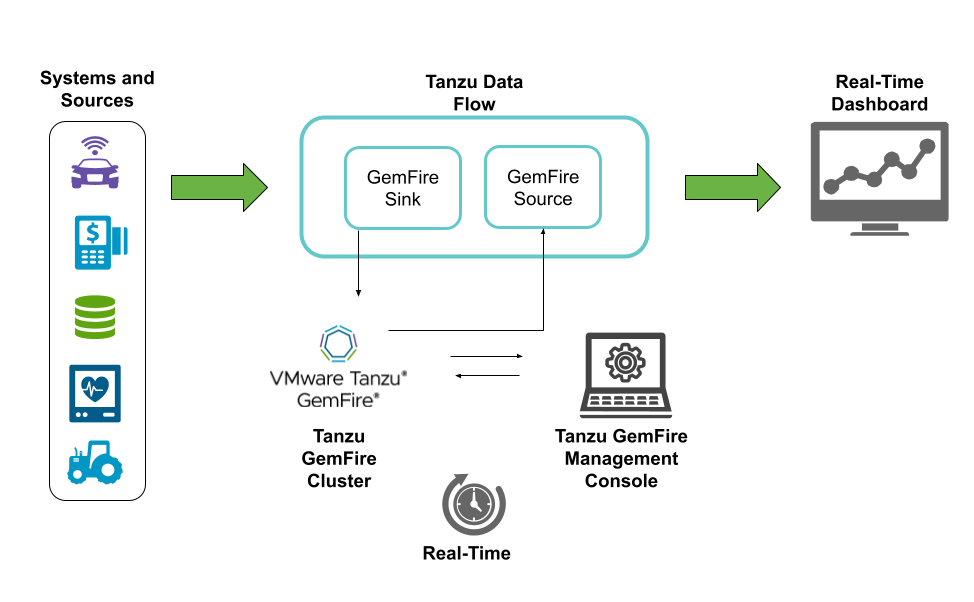
Fig 2. Real time dashboards using Tanzu Data Flow and Tanzu GemFire
Tanzu Data Flow lets users design and deploy data pipelines with a visual interface.Tanzu GemFire stores and serves live data directly from memory, enabling dashboards to update in real time. The Tanzu GemFire Management Console gives users full visibility into the data layer, including the ability to inspect regions, monitor cluster health, and validate incoming data, all from a browser-based UI.
Building pipelines without code: Tanzu Data Flow in action
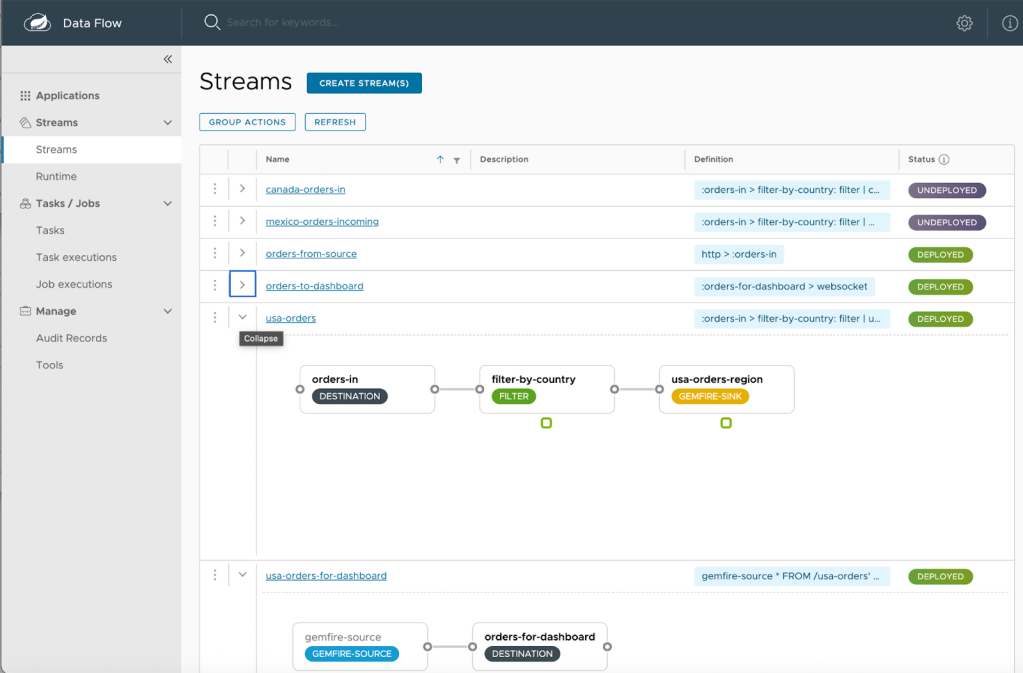
Fig 3. Tanzu Data Flow UI with drag and drop pipeline development
Tanzu Data Flow’s UI turns pipeline development into a drag-and-drop experience. Imagine your system is generating a live stream of orders, for example from a REST endpoint, a message queue, or a database. With Tanzu Data Flow, you can route those orders into your GemFire cluster in just a few clicks.
Start by opening the Tanzu Data Flow UI. Drop a source on the canvas to capture the incoming orders. Connect it to a GemFire sink, which writes the data into memory for real-time access. Then, if you want to power a dashboard, connect a GemFire source to stream that same data into a visual front- end or external system.
You can configure filters, add processors or aggregators, monitor pipeline health, and redeploy on the fly all from the same UI.
No back-end code. No dev cycle. Just a live data pipeline, built in minutes.
Real-time data starts with GemFire
While Tanzu Data Flow handles the flow of data, GemFire acts as the real-time memory layer that makes that data instantly accessible. Unlike traditional databases that rely on extract-and-load cycles, GemFire stores your working data directly in memory. It updates instantly and supports sub-millisecond access across large clusters.
GemFire then emits events the moment data changes, enabling downstream pipelines or dashboards to react in real time. This is what turns raw event data into actionable, always-fresh insight, not a snapshot from five minutes ago, but exactly what’s happening now.
The Tanzu GemFire Management Console: Your real-time control panel
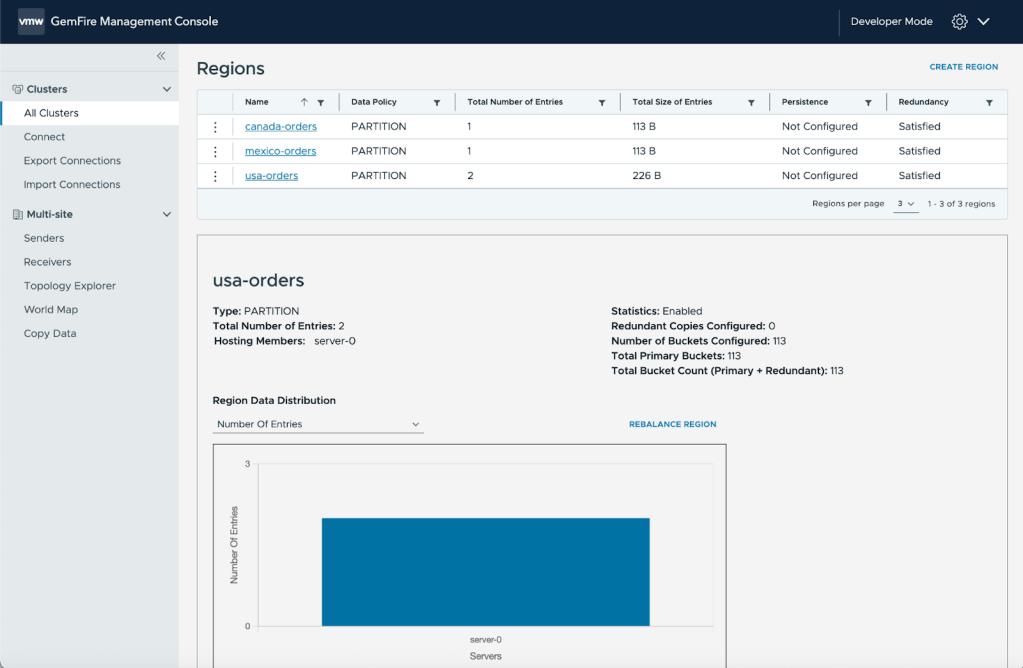
Fig 4. Tanzu GemFire Management Console
The GemFire Management Console provides a clean, browser-based UI where users can interact with live data in real time in powerful ways:
- Inspect or create data regions, such as
/orders,/inventory, or/fraud-signals - Watch records flow into memory as they arrive
- Quickly review incoming data to catch formatting problems or unexpected values
- Monitor cluster health and memory usage
No back-end code is required. No command line tools are needed. Just a real-time view of your data, with the ability to act on it.
The console pairs naturally with Tanzu Data Flow’s pipeline UI, giving your team full visibility and control over both the data layer and the streaming logic.
A Day 1 dashboard: How it all comes together
Let’s say your company is launching a new product line in France tomorrow. During the final pre-launch meeting, someone notes that you need to track real-time order flow for France on Day 1. But the dashboard doesn’t support it yet.
It’s on the backlog. The ticket hasn’t been picked up. There’s no time to wait for the next sprint or deployment.
Instead, here’s what you can do:
- Open the GemFire Management Console and define a new region. For example,
/orders-france. - In Tanzu Data Flow, build a new pipeline on the visual canvas:
- Add a source to capture orders from an internal system.
- Send those orders to a GemFire sink, routing them into
/orders-france. - Then connect a GemFire source to send that region’s data into a dashboard sink.
- Add a source to capture orders from an internal system.
- Configure filters, transformations, or routing logic as needed.
- Click Deploy.
- Watch the dashboard update instantly as orders arrive.
Within minutes, data is flowing from order to dashboard, in real time.
This is what real-time agility looks like when your data layer and streaming tools are built for speed and flexibility.
No back-end changes. No deploy cycles. No waiting.
Not just faster. Fundamentally different
The promise of real-time insight has been around for years. However, it’s often been locked behind infrastructure, deployments, and developer capacity. With Tanzu Data Flow and Tanzu GemFire, real-time pipelines and in-memory data are more accessible to everyone: analysts, operators, and business teams.
No code. No bottlenecks. No stale data.
Want to see it in action?
We’ve published a demo example that walks through this exact setup. It includes everything from pipeline creation in Tanzu Data Flow to real-time event streaming in Tanzu GemFire. You can even simulate incoming orders and visualize the data flow using a basic UI.
If your dashboards still depend on batch jobs and deployment cycles, it’s time to rethink what’s possible. Tanzu Data Flow and Tanzu GemFire can remove the wait time, the handoffs, and the complexity. You can turn live data into action faster, making real-time insights possible, accessible, and ready when your business needs it most.


