

This blog is the second of a three-part series on KPIs and Metrics, which covers:
- A quick summary of Part 1, KPIs and Metrics: Their Importance and Value
- Approach to defining and implementing KPI reporting
- Challenges (there always are) around collecting the data needed to implement KPIs and dashboards
In our earlier blog, we discussed the definitions and value of KPIs and metrics in that they help us make decisions and take actions. We also presented some best practices around aligning them with expectations, ensuring their actionability, presenting them as trends versus thresholds, and how they should be communicated. In this post, we are presenting a plan for how you can establish best practice KPIs and what some of the challenges are, for which executive sponsorship will be key.
Part 1 Summary
In Getting Started with KPIs and Metrics Part 1, Their Importance and Value, we discussed the:
- Definitions of KPIs (%s), Metrics (#’s) demonstrating that KPIs are composed of multiple metrics or even other KPIs
- Need to tier, stratify, organize KPIs based on their audiences, stakeholders and required actions
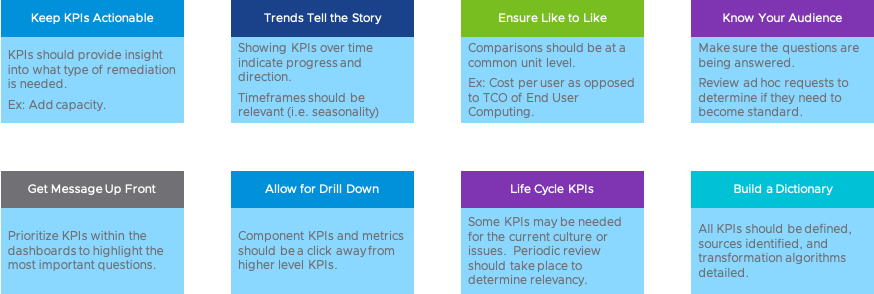
- Best practices around defining and organizing KPIs and their metrics ensuring performance, financial, and partner reporting. Key ones included having actionable KPIs to aid in making decisions and trending them over time to indicate directional behavior.
Approach
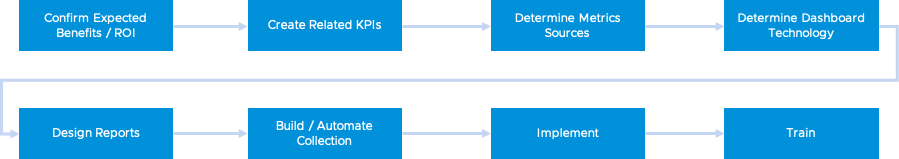
So, where do we begin? There are some basic steps beginning with confirming expectations to ensuring a continuous process, as shown in Figure 2, that we have found to be effective in establishing meaningful KPI reporting.
Confirm Expectations
We should begin by understanding what questions we are trying to answer. What are the expected benefits? Was there a document, such as a contract or a whitepaper, detailing them? Were sales representations made? What IT and business problems are being solved (as we model in VMware’s Outcome-Focused Approach)? What industry rules of thumb are relevant here? Does Gartner, Forrester, or IDC indicate categories of industry-related results?
Create Related KPIs
Once these expectations are agreed upon, determine what KPIs will be needed to monitor and prove the point. Break these down to their Executive, Management, and Operational tiers as described in the first blog of this series. For example, I, as a customer, am expecting a reduced cost of ownership and increased stability from a hyperconverged infrastructure (HCI) based private cloud. The Executive KPIs would be % Available and % Reduced Costs. For Availability, we then could drill those down to Management KPIs of % uptime [ by environment], % incidents [by category], etc. At the Operational level, we would capture metrics on utilization, throughput, uptime, downtime, incidents by component, etc.
Determine Metrics Sources
We then need to map these KPIs to their component metrics. We covered some in the above % Available example. For % Reduced Costs, these metrics could be the total cost of ownership (TCO) of the legacy environment compared to the total cost of ownership of the new environment plus associated costs of transition and migration. For example:
% Reduced Costs = 1-(TCO New + Migration + Transition) / TCO Legacy
Determine Dashboard Technology
Now that we know the KPIs, metrics, and source systems, we need to confirm the platform that will be used for reporting and displaying the KPI dashboard. Usually, a company has a technology standard for reporting for which there are in-house expertise and licenses available. This decision point takes place here in the approach because the requirements are better understood and can be evaluated vis a vis the platform’s capabilities. These will also figure into the design of the reports.
Design Reports
The design of the reports should reflect the earlier mentioned best practices (actionable, tiered, trended, drill-down) and be collaboratively developed with iterative stakeholder sessions. The implementation of the dashboard should not be a surprise to any of the stakeholders.
Automate Data Collection
A best practice is the automation of the collection and transforming of the data. The algorithms, lookups, and definitions of the elements should be defined in a data dictionary, which serves both as an automation requirement for the developers as well as a reference tool for the users. At this point, we know the source systems, data extraction / transformation & load (ETL) requirements, and target dashboard. Some of the tools may already have automation tools that can be used. If not, a data extraction tool may be required. In any case, as the process is determined, it needs to be documented, including roles and responsibilities (RACI), service level agreements (SLAs), etc.
Implement
Implementation should consist of a period in which data is collected over enough time to show valid trends and expose any challenges in the process. Typical challenges in the automation process usually are, for example, in the coordination of the availability of data from multiple systems, changing formats, missing records.
Train
Success will be determined not only by the accuracy and meaningfulness of the KPIs but also in the consistent of execution of the process. This will require the training of the team who will operate and maintain the system. Ensure that all process and data documentation is up to date and fully understood by the team.
Challenges
Data Access
We have already mentioned a few challenges around data coordination and completeness. But among the challenges, data access is the major one. In larger enterprises, source systems are owned by different technology or business silos. There may be a reluctancy to share due to workload efforts or just plain politics. To remediate this challenge, ensure that the sponsorship of the effort is high level and has authority.
Cross Platform / Vendor / Organization Sources
Often KPIs are comprised of metrics from multiple sources, some of which may not be VMware products. Showing progress often requires pulling in data from the enterprise. As in the data access challenge, permissions may be questioned. Once again, to remediate this challenge, ensure there is a high-level sponsor who understands the importance of the access to data sources as they relate to the KPIs.
Data Metadata
Data correlation is always a challenge because data from various systems may have different or no metadata through which analyses can be performed. As mentioned in the earlier section, remediation may require building correlation tables and using them for ETL activities.
Data Accuracy
Data accuracy is the dream of all business information and dashboard systems. It is always a challenge. Often data repositories are not maintained consistently, have standardized entries, are subject to audit, etc.
Review, assess, and rate the data sources. KPI reporting may have to be put on a roadmap after a basic data remediation project has been chartered and executed.
Summary
In this second of our KPI blog series, we presented an approach and challenges to implementing best practices KPI and metrics reporting. Success is in the business relevance of the KPIs, mapping, and accuracy of the collected data and incorporation into an automated reporting system. There will always be challenges, most of which can be met with the aid of executive sponsorship. In the next, final of this blog series, we will cover:
- Relevant examples of KPIs used for tracking customer success
- Tangible and intangible KPIs, metrics and sources
- Product / Service-specific examples
- Sample dashboard designs
VMware Professional Services can help you understand how to incorporate KPIs and Metrics in your existing processes. Contact your VMware representative to learn more.
About the Author
 Norman Dee is a Staff Architect covering transformation enablement services within the IT and digital workspaces. He is a specialist in Operating Model, Cloud Management, IT Financial Management/Business Case and Capacity Planning. In his role, he helps enterprises fully understand the technical and financial benefits of operating model and infrastructure transformations. His career has spanned roles from directing worldwide projects to CTO/CIO, across multiple industries including financial services, media, publishing and online retail.
His experience includes IT-as-a-Service transformation, IT Service Management processes, managing overall distributed strategies, infrastructure management & chargeback, e-Commerce, application development life cycle, QA, network modeling, and capacity planning.