By Tom Hite, Sr. Director, Professional Services Emerging Technology and Tom Scanlan, Architect, Professional Services Emerging Technology
Many modern software applications operate across multiple clouds, giving rise to the need for broad operating patterns, such as the six sevens. As that pattern notes, a significant challenge many face is understanding the true operating state of the entire system.
Why Observability
Observability is key to understanding the state of a system, which helps in maintaining proper operations. When things degrade or break, observability is what informs us about problems. It supports root cause analysis and lets us understand the effect of repairs.
If observability is lacking or wrong there exists, at best, suboptimal understanding of any system. That often results in the inability to assure intended outcomes – software services may not live up to service level objectives or agreements. As noted in Site Reliability Engineering, Chapter 3, absent well-formed observability, operations teams “have no way to tell whether the service is even working . . . you’re flying blind.”
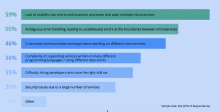
The challenge for many customers is the software industry finds no shortage of reasoning about what observability comprises. Possibly a better understanding comes from control theory: observability is the ability to understand system state from external outputs. With that in mind, many surveys, such as one recently taken by Camunda Services GmbH, indicate the biggest problem with microservices implementations is observability.
A Recap of The 2018 Microservices Orchestration Survey: What challenges does your organization face with a micro-services architecture?

Source: Camunda Services GmbH, http://blog.camunda.com/post/2018/09/microservices-orchestration-survey-results-2018/.
Providing Observability
Observability is not a single ‘thing,’ rather is an outcome of well written software and platform integrations. The main components needed to provide software observability include tracing, monitoring, logging, visualizing and alerting. Note that the concept of a visualization system could be considered to comprise partially alerting, but alerting is important enough to raise separately.
Providing observability commonly includes a need to instrument code. Instrumentation is the practice of adding to code projections of various measurements and events. For example, logging calls to a particular function or adding call flow information (i.e., tracing). All code should be reasonably instrumented to give explicit insight into operational state.
For example, if an application is processing documents, it might expose a running count documents processed, how many processed successfully and how many failed processing. The code processing the documents tracks and exposes those measurements during document processing to reveal the state of the application as it is running
Tracing
Tracing is a method of following transactions throughout a system, such as introduced in Dapper and more recent projects like Zipkin and Jaeger. Consider that a transaction, as used here, is any form of invoking functionality within a system. That includes function calls with relevant parameters in compiled executables and calls to a web service over the network. In multi-cloud applications the transaction flow may traverse several functions, services and networks.
A common method for enabling tracing is attaching unique identifiers (ID) to originating requests to or from the system. The ID is passed on to any subsequent functional invocations made. Logging and monitored metrics can then associate with the ID and, when assembled with timestamps, provide full end-to-end visibility of the activity involved.
As applications fragment from monoliths in single data centers into microservices running potentially across many availability zones or cloud providers, tracing will become more important. The complexity of an end-to-end transaction increases rapidly with service and network boundaries. With more boundaries, tracing is the only way to understand the system.
Monitoring
Monitoring systems hold temporal measurements of the state of software from a mix of external sources, such as OS provided per-task CPU usage and instrumented (outwardly projected) measurements. There are many ways to connect the measurements to monitoring systems and each system has its own requirements. These timestamped and usually tagged measurements are called metrics. There are two broad categories for providing access to metric data: push and pull.
In a push type monitoring system, one generally needs instrumented code to ‘push’ information to the metrics collector. Instrumented code detects the proper metrics collection (monitoring) system using service discovery, connects to it and sends (pushes) the appropriate measurements.
In a pull type system, instrumented code (including OS kernels for CPU usage and the like) maintains all the measurements and exposes them via various mechanisms. For example, access may be provided by a built-in web-server endpoint (e.g., http://api.myservice.com/stats). A metrics collector service is then used to discover all services to monitor and scrape the URLs to gather the measurements.
Anything that is key to running software services should probably be monitored. If there is a key performance indicator (KPI) related to the work the software performs, it should definitely be monitored.
Beyond KPIs, diagnostic metrics are helpful in tracking down bugs in the system. This kind of metric is geared toward detailing the state of functional parts of the system, therefore can grow quite large. Literally monitoring everything will likely overburden any monitoring platform.
There is a balance to be found between monitoring everything and monitoring only KPIs. For operations, seek the minimally complete set of measurements for live system state assessment. Simple examples include, current capacities (free CPU, disk and bandwidth, etc.), transactional volumes, stability (error counts), latencies and many more.
As noted already, monitoring everything likely will overload the monitoring system. Unimportant or arguably duplicative measurements simply should not be aggregated, regardless of their availability.
An example of possibly superfluous, duplicative information might be monitoring disk free space. The important state may be the rate at which free space is changing. With a constant rate of zero change in usage likely presents no issue, regardless of remaining capacity. A disk with 100GB total capacity with free space decreasing a rate of 5GB per minute suggests there may be a catastrophic problem quite soon.
When things are breaking, one cannot lose their senses, quite literally. Observability involves ‘state sensing’ so must be always stable, running and available.
One should consider maintaining a dependency-free monitoring system to alert if the main monitoring system is failing in any way. In multi-cloud situations, each site can watch the other. Providing notifications when the main monitoring system does not appear healthy is a given in most cases.
Logging
Both logs and metrics require instrumentation. At times, it may not be clear what one should log versus consider a monitored metric. Generally, logs record specific activities along with related attributes. For example, logging a call to a database with the SQL (attribute) for debugging purposes. Metrics, on the other hand, record measurements of a particular value over time.
As with monitoring, logging every activity software performs likely will overburden the log aggregation system. On the other hand, with the advent of big data and machine learning, the value of information may not be known at the moment of designing a system and its observability. Striking a balance between actual need and future interest is something to consider.
Also relevant is the need for various log protections. For example, audit logs should be protected for later evaluations. In terms of data classification this suggests considering integrity and availability security objectives. When audits occur, logs must be in a known location and must be trusted to be unaltered
Visualizing
The term observability itself suggests a visual capability, not always invisibly programmed watches and resolutions. The visualization component should, for example, provide for easily visible dashboards, alerts, performance, trending and the like – all containing actionable, not superfluous, information. A visualization system should enable humans to comprehend the system state, and should have various levels of detail to prevent information overload.
For example, critical KPIs should be grouped into easily viewable dashboards, which track measurements that are key to understanding that a system is operating normally. Another example is easy visualization of tracing data for performance testing and tuning, as nicely shown in an Uber article, depicted below.
Evolving Distributed Tracing at Uber Engineering

Source: Uber, https://eng.uber.com/distributed-tracing
Alerting
An alerting system is needed so that operators don’t have to watch the visualization system all day, every day without fail. Instead they can be notified directly that something is starting to go awry, therefore action may be required. Building on that idea, an alerting system could also trigger an automatic repair of common problems. As the ratio of human operators to systems goes down, the need for automated remediation systems likely goes up.
As with dashboards, information overload is potentially detrimental, possibly causing the cry wolf syndrome. If alerts are disseminated frequently, there definitely exists a problem. Such alerts should be reviewed immediately. One might find that the alert is not a bona fide operational issue, rather a code issue. Possibly removing the alert is the fix. On the other hand, possibly it is a bug in the code, thus a developer should work it out until the frequency is more in line with reasonable expectations.
Conclusions
Distributed software systems, including multi- and hybrid-cloud systems beget the need for high quality present-state operational status. Understanding the operational state, a.k.a. observability, involves a mix of distributed tracing, monitoring, logging and visualization capabilities. Don’t wait until you have deployed your software before designing in and implementing this very important matter. Start today and sleep better tomorrow! If you want some outside assistance getting started, we are always here to help at VMware.
Sr. Director, PS Emerging Technology at VMware, Tom Site holds responsibility for research and innovation for world-wide Professional Services. Prior to its acquisition by VMware, Tom served as VP/CTO at MomentumSI, Inc.; was co-Founder and CTO of Metallect Corp.; Chief Technology Officer at AMX Corporation and Chief Executive Officer of Phast, AMX’s wholly owned subsidiary. Mr. Hite holds multiple patents in networking, artificial intelligence and semantic analysis; has a MSME and is a Juris Doctor with Highest Honors.
Tom Scanlan has been in the technology industry for roughly 20 years. He started in systems and network engineering roles, but found a passion for automating everything. This led him into software engineering, where the bulk of his career has been spent in DevOps-y roles. He is currently an architect responsible for researching and applying emerging technologies to business problems.
VMware product feature disclaimer:
- This document may contain product features that are currently under development.
- The document represents no commitment from VMware to deliver these features in any generally available product.
- Features are subject to change and must not be included in contracts, purchase orders, or sales agreements of any kind.
- Technical feasibility and market demand will affect final delivery.
- Pricing and packaging for any new technologies or features discussed or presented have not been determined.
- This information is confidential
© 2019 VMware, Inc. All rights reserved. This product is protected by U.S. and international copyright and intellectual property laws. This product is covered by one or more patents listed at http://www.vmware.com/download/patents.html. VMware is a registered trademark or trademark of VMware, Inc. in the United States and/or other jurisdictions. All other marks and names mentioned herein may be trademarks of their respective companies.


