By: Greg Hohertz, Blue Medora
In Part 1 and Part 2 of this blog, I discussed how you can monitor vCenter’s databases remotely using Blue Medora’s Management Pack for PostgreSQL and Microsoft SQL. Monitoring database performance is important to understanding the performance and health of your vCenter server, but it is just as import to understand the performance and health of the vCenter server itself. In this blog, we’ll take a look at vCenter specific metrics, best practices, and how you can monitor these with vRealize Operations Manager.
First, it is important to understand the best practices and to identify which performance metrics really matter when monitoring vCenter. For this, we will take a look at VMware’s Technical White Paper “VMware vCenter Server Performance and Best Practices.” This white paper addresses key performance indicators for vCenter health and performance, as well as capacity metrics to watch. We see that CPU, Memory, Disk I/O, Network Throughput, Network I/O, and Concurrency (number of vCenter operations run currently) are the key indicators for performance and capacity.
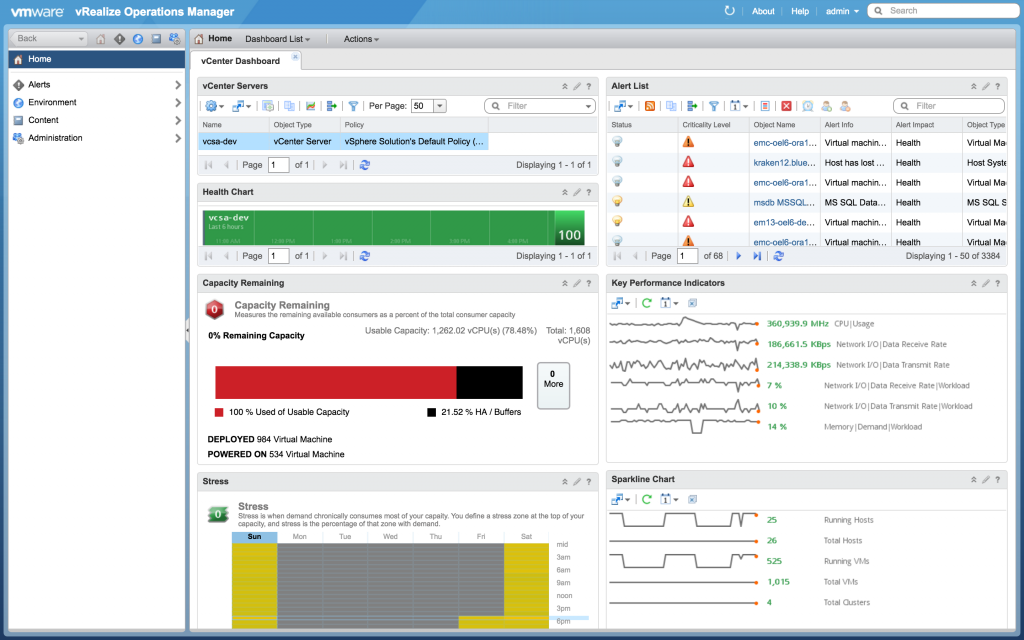
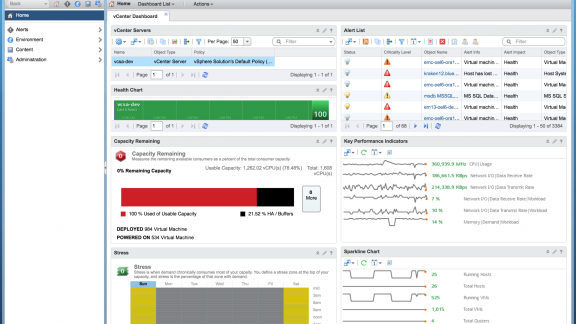
Figure 1: Monitoring vCenter Dashboard
Luckily, vRealize Operations provides most of the key metrics we need to monitor. Additionally, we can leverage vRealize Operations’ analytics to understand both the capacity and stress of our vCenter server. After selecting your vCenter server on this custom dashboard, a number of key widgets will give you insights into your vCenter server performance and capacity.
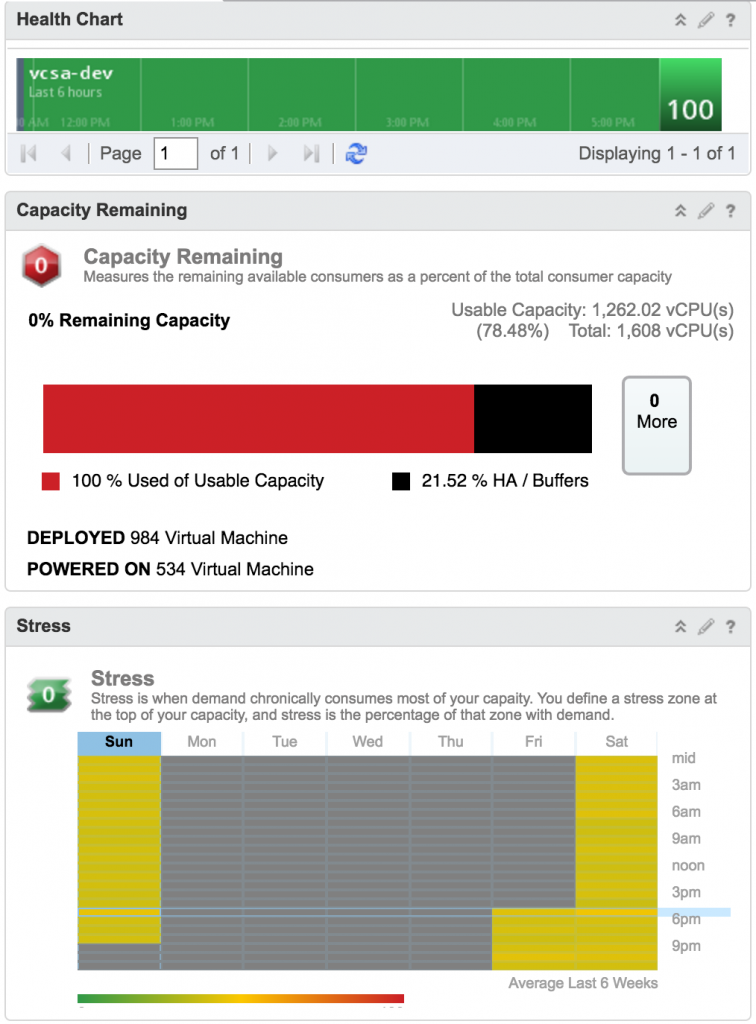
Figure 2: Health, Capacity, Stress
Down the left-hand column we have three indicators:
- 6-hour historical health of the vCenter server: showing the calculated overall health of your vCenter server for the last six hours
- Capacity remaining widget: showing your capacity remaining based on the most constrained resource
- Stress widget: showing the demand against vCenter capacity over time
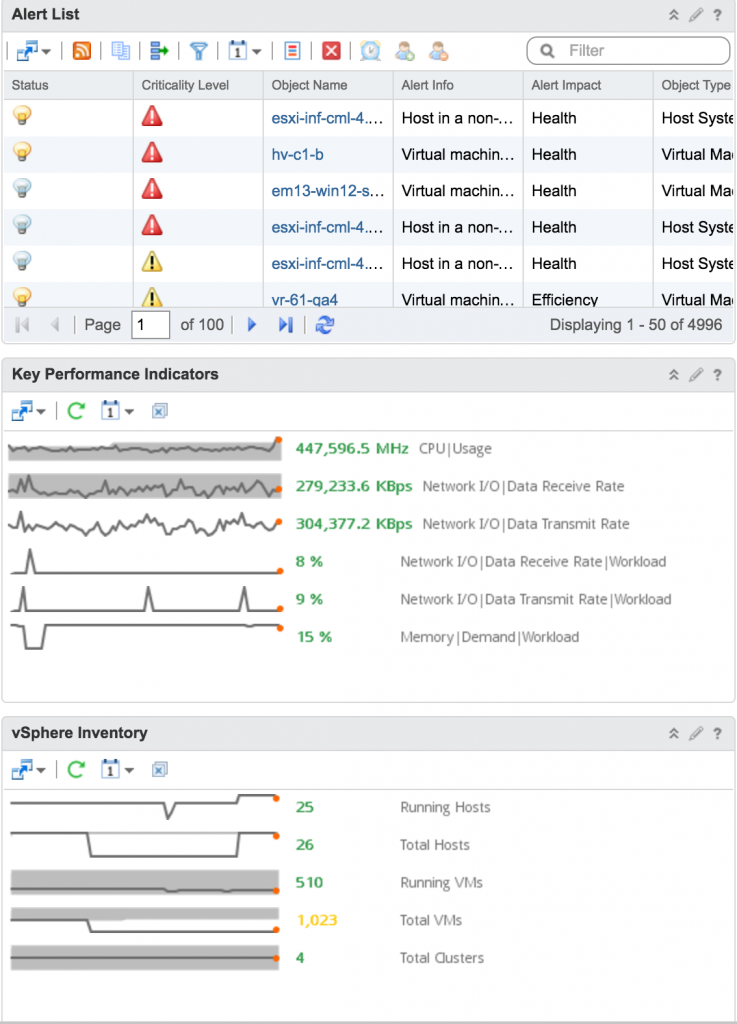
Figure 3: Alerts, Key Performance Indicators, and Inventory
Down the right column we have three widgets that display open alerts on the vCenter server, key performance indicators, and an inventory of resources managed by your vCenter server. Under Key Performance Indicators, CPU, Memory, Network Operations and Throughput are all displayed along with a 6-hour sparkline showing the historical values of these metrics. Next is an inventory of Virtual Machines and Hosts (both totals and online) as well as total Clusters managed by this vCenter instance.
By combining remote database monitoring using the Blue Medora database management packs and the out-of-the-box monitoring provided for the vCenter instance, we now have some insight into the performance and capacity of our vCenter server. Next step is to set up some symptoms and alerts to notify us when anomalies occur relative to capacity or performance.
