
By Tristan Todd, Architect, End-User Computing, VMware
and Tirtha Bhattacharjee, Quality Engineer, End-User Computing, VMware
In this second post in a series, we are chronicling our work on a performance and scalability reference architecture project for VMware App Volumes. We have completed build-out of the lab environment and finished our validation testing, and we are now nearly complete with the performance and scalability testing. It is almost time to go through a mountain of performance data and analytics logs as we get ready to sharpen our pencils and get to writing.
To date we have run over 38,000 desktops through the test environment and accumulated over 500 MB of performance and analytics logs. We have also consumed a massive amount of coffee and peanut M&Ms! We have learned so much already; we are eager to give everyone an early glimpse of some test results.

Wait, What Are You Doing Again?
If you missed it, review the first post in this series, App Volumes Performance and Scalability Testing – Preparing to Test, where we talk about our test hypotheses and methodologies. Some of the deployment information in the rest of this post will make more sense if you have read the first post.
Last-Minute Changes to the Test Environment Hardware and Configurations
Almost as soon as we began, we made changes to our carefully thought-out design. This is not always a bad thing—let us explain.

Sitting and waiting for a desktop-pool deployment or recompose during one of these projects is painful. You get so eager to test the next scenario, and you sometimes have to wait while your traditional HDD-based array keeps up with provisioning operations. A few weeks before testing, our friends on the EMC XtremIO team offered us one of their innovative, all-flash X-Brick arrays. Wow! Pool deployments in 80 minutes? No problem. Recompose in 2 hours? No problem.
To date in our testing environment, we have yet to see a server or desktop VM with more than 2 ms of latency. Faster storage means faster testing. It also means we can do different things with our datastore sizes and density. In the interest of deployment simplicity, we have elected to test with a 2000-desktop linked-clone pool that is hosted on only 4 datastores (each 2 TB in size).
Most of the other environment configurations have remained the same, though we have removed the NSX load balancers from the environment and chose only a single App Volumes Manager server and a single View Connection Server. We would love to have included a resilient, load-balanced deployment in this testing. We just ran out of time during our deployment phase.
Adjusting Our Expectations About Density
Login VSI is an amazing tool for orchestrating workloads in a test environment. After deploying and customizing your environment, you can relatively quickly and easily spin up hundreds of users and desktops to evaluate the performance and capacity of a vSphere environment. Based on our past Login VSI testing, we estimated that we could easily run 2000 View linked-clone desktops in Horizon 6 on our 18-host vSphere cluster. We were somewhat off in our estimate, because the new Login VSI workloads are a bit more intense.
After our initial environment validation testing, we quickly discovered that the new Login VSI v4.1 workloads are more demanding than previous workloads. Using the Knowledge Worker workload with a 64-bit Windows 7 image, 2 vCPU, and 2 GB of RAM, we loaded as many desktops as we could on a host until the host CPUs reached an average of 80 percent usage. And we discovered the ideal number of desktops per host with this workload is about 88. And that works out to about 9 vCPUs per host processor-core. Although Login VSI workloads have become more intense, they more closely model real-world user workloads, and that is a good thing!
Some of Our Test Scenarios
Our test scenarios are all run with a 2000-desktop linked-clone pool that is running at 80 percent session concurrency. During all tests, 80 percent of the pool desktops have a user logged in doing work.
Here is a description of our first three test scenarios:
- Native Apps: View virtual desktops in Horizon 6 with natively installed applications
- App Volumes Scenario 1: View desktops with all test applications delivered in a single AppStack, plus one writable volume
- App Volumes Scenario 2: View desktops with test applications split across three AppStacks, and one writable volume
Early Performance Testing Results
We have seen excellent performance results in our testing. We are keenly interested in comparing the performance characteristics of View desktops with and without App Volumes AppStacks and writable volumes.
Using Login VSI, we logged in a new user every 4 seconds until we reached 80 percent concurrent session load (1600 active users) and then let the workload run for about 4 hours. During the test run, we used vRealize Operations, vRealize Log Insight, vCenter, and Windows Performance Monitor to record detailed performance statistics. Login VSI also records an impressive number of user experience metrics that are all used to produce a score called VSImax. This score represents that most desktops you can run in a particular environment with good user experience. Run more desktops than your VSImax, and your users might not be happy with their desktop experience.
The following table summarizes the results of this first performance test.

In our first three scenarios we saw very solid performance, with App Volumes showing about 10 percent more host CPU usage at peak average. Host memory peak usage was the same in all three scenarios. Because host CPUs are driven harder when App Volumes is used, we must run at a slightly lower density of desktops per hosts.
We want to share some storage findings as well. We (and many of you) are keenly interested in how App Volumes impacts storage performance and capacity.

With 1600 active users, we observed that storage I/O consumption patterns (both reads and writes) change with the introduction of App Volumes into a View environment. The cumulative rates of both read and write I/O is higher in both App Volumes scenarios, and both reads and writes are significantly reduced for the linked clones themselves. For organizations that do not assign writable volumes to their users (only using AppStacks), there is a marked decrease in cumulative I/O rates. With the increased overall demand for read IOPS, and because so much of that read I/O is application-centric, it is reasonable to assume that lower-latency storage will greatly impact an environment where App Volumes is deployed. Storage systems with faster read performance (Virtual SAN and all-flash arrays) will benefit App Volumes performance.
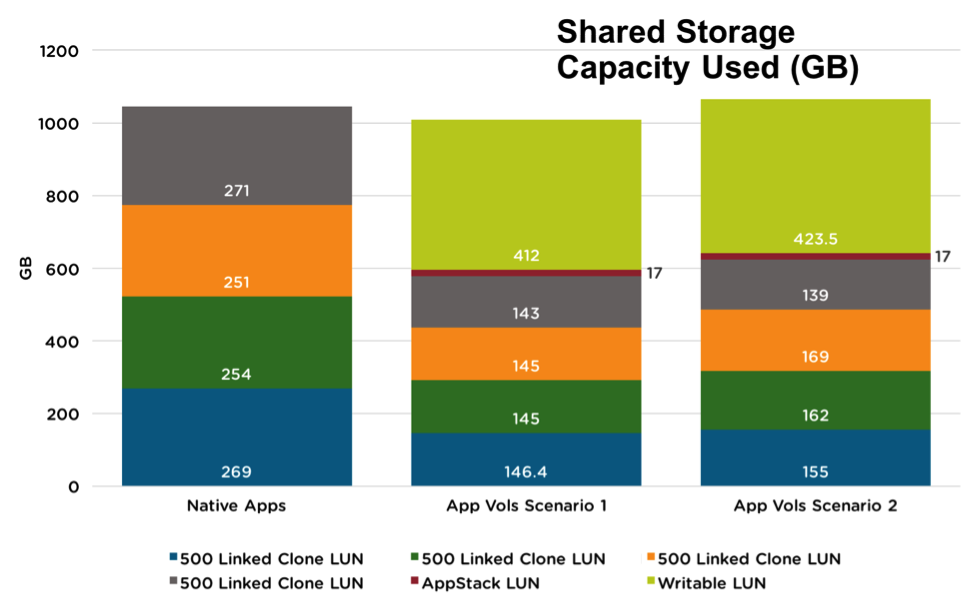
We observed storage capacity benefits from App Volumes as well. Linked-clone desktops consume far less storage when they all share common AppStacks. App Volumes can help minimize the hosted desktop storage footprint. If writable volumes are not deployed (users are assigned only AppStacks), there is a tremendous reduction in overall storage footprint as compared with natively installed applications. Depending on the writable volume configuration, storage capacity can be reduced as well.
What’s Next?
We are working hard (and consuming lots of caffeine) to wrap up our testing operations. We are looking forward to completing the data analysis and then putting everything together into a white paper. We expect to have the paper published soon.
Note: After first publishing this post on 11 December 2015, we completed additional testing that resulted in updated VSImax scores and storage performance and capacity metrics. We have updated this blog post to reflect these new figures. We will include full details and final testing results in the reference architecture white paper.


