Recently, we announced two new additions to Advanced Monitoring for VMware Horizon Powered by ControlUp – Remote DX and Scoutbees.
Today, we will focus on Remote DX and show you how easy it is to enable and use it to better manage virtual desktops and apps. To learn about Scoutbees, see our previous post, Day-One Horizon Monitoring with ControlUp Scoutbees.
Why is Remote DX important? To ensure an exceptional Horizon end-user experience, the availability of Horizon virtual desktops and applications is only one part of the equation – reliability, stability, and connection security of user endpoint devices are equally important. To assist with this, VMware now offers ControlUp Remote DX, a monitoring solution for endpoints that connect to Horizon desktops and applications. Remote DX can collect information such as the quality and speed of a Wi-Fi connection or about the VDI client itself.
Verifying the License
With ControlUp Remote DX, you need only to ensure that you are licensed for it and then install a single file on the endpoint that you want to monitor.
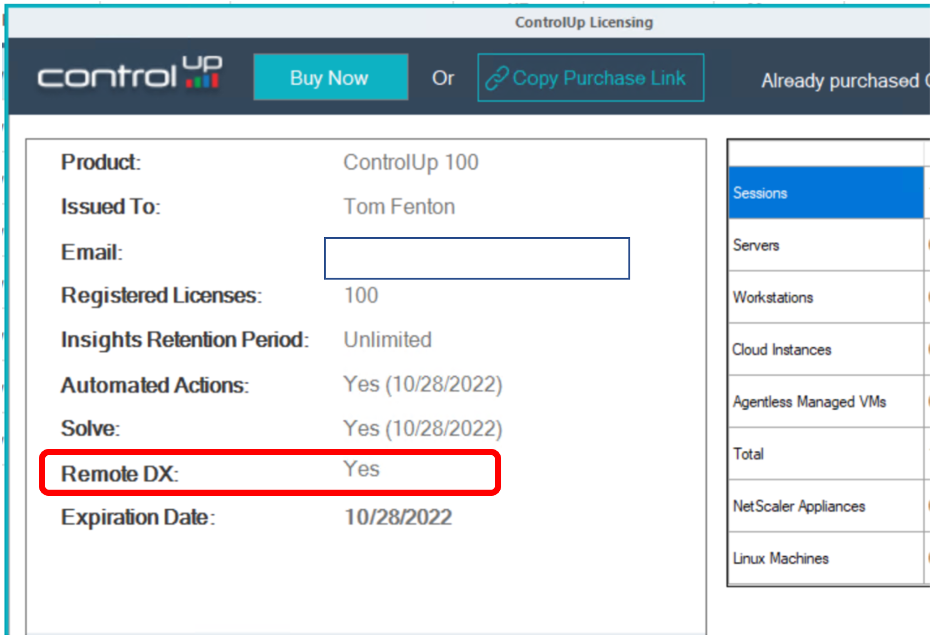
You can verify that your ControlUp instance has been licensed for Remote DX from your ControlUp Real-Time Console by clicking Help > About > Licensing.

In the licensing dialog, verify that Remote DX is enabled. If it is not, contact your VMware account representative to purchase or get a trial license for it.
Enabling the Horizon Client
ControlUp Remote DX currently supports the monitoring of endpoint devices that are running Windows, macOS, IGEL OS, or HP ThinPro. For our purposes here, let’s focus on a Windows endpoint device connected to a Horizon desktop. ControlUp has an article on how to deploy it on other devices.
Remote DX’s single file extension is placed on the client device, and it doesn’t require an agent or service to be installed or any additional ports to be opened. It uses a channel from the Horizon client to relay information back to the ControlUp Console. This greatly simplifies the operation, but it also means that you will only receive information about the endpoint device while the user is connected to their Horizon desktop or application.
The file that is placed on the endpoint device can be downloaded directly from the ControlUp Download Center. (You may need to scroll to the bottom of the page to see it).
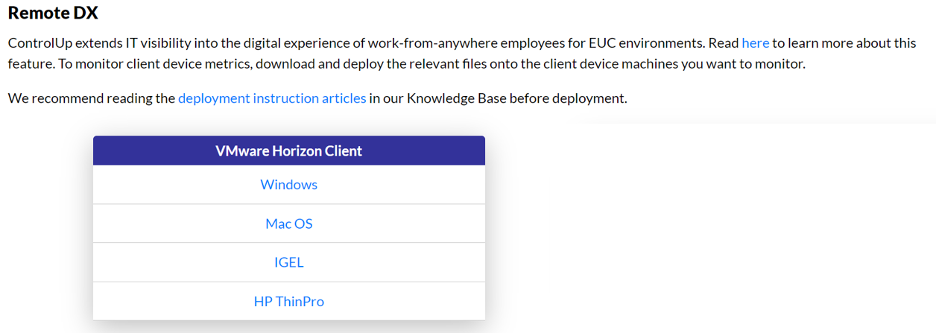
After clicking Windows under the VMware Horizon Client column, you can save the file to the relevant endpoint device.
The Remote DX is enabled once EULA is accepted.

Viewing Remote DX Metrics in the ControlUp Real-Time Console
To test whether a Horizon client was reporting Remote DX metrics, it is important to connect to a Horizon desktop from the Windows device where the Remote DX files were installed.
From the ControlUp Real-Time dashboard, select the desktop pool and then Sessions. From the Column Preset drop-down menu, select Remote DX.
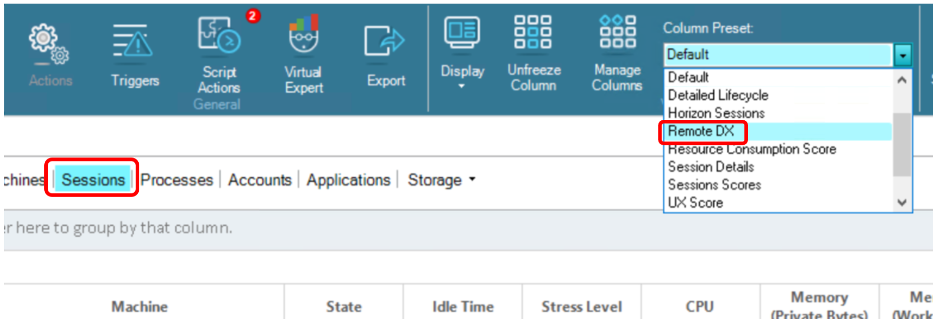
In this example, we don’t see any information shown in the client columns.

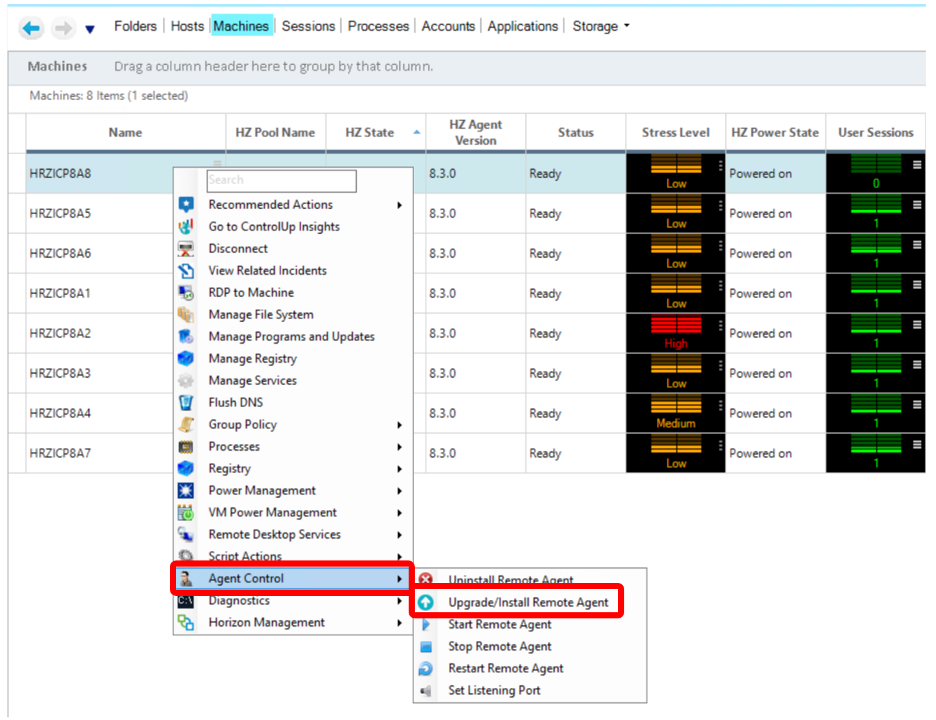
To address this, from the Agent Control drop-down menu under Machines, you can Upgrade/Install Remote Agent if you have an older ControlUp agent. (Note that the remote agent is the ControlUp agent, not the Remote DX file that was previously installed.)
From the Session dashboard, it’s now easy to see information about the client. In the screenshots below, you can see the columns collected and displayed about the client with Remote DX enabled. Above it, you can see a client without Remote DX installed.
The first group of columns is the most informative, as they display the Wi-Fi signal strength and latency from the device to the LAN.

Further to the right, detailed information about the NIC on the client can be found.

Scrolling even further to the right, you can see information about the connection to the Wi-Fi router. This information is valuable since it shows whether the connection was made using secure authentication (Wi-Fi Authentication).
Mesh Wi-Fi networks are increasingly used in offices and homes, so Remote DX also shows the SSID and BSSID names. In a mesh network, all the nodes have the same SSID, but different nodes have different BSSIDs. This information allows you to see exactly which node to which a client is connected and pinpoint a bad node in their mesh.

Viewing Remote DX Metrics in Solve
Solve, ControlUp’s SaaS-based console, also displays Remote DX information intuitively.
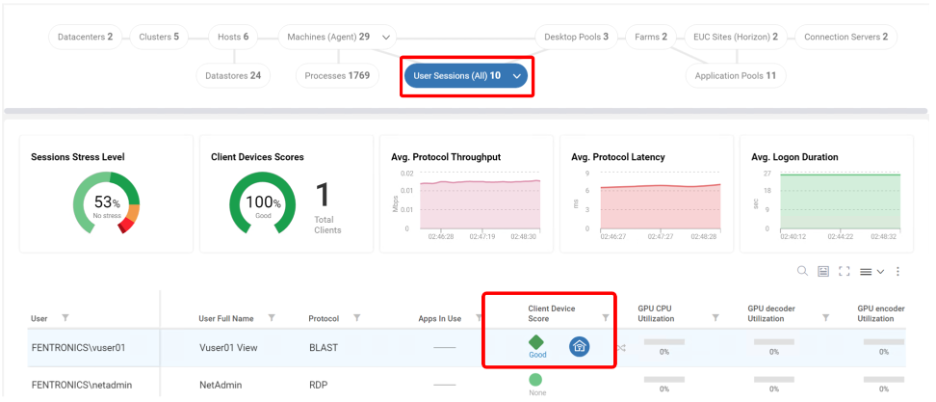
After launching Solve, click on User Sessions in the topography view, and then select your session. After hovering over the Client Device Score, the Home icon will appear.
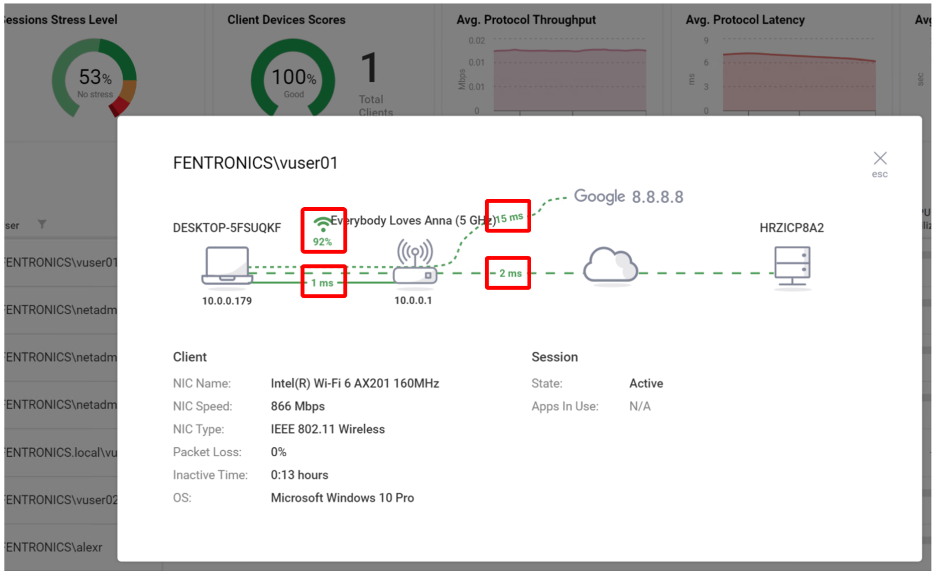
Clicking the Home icon, a pop-up showed the connections from the client device. From this screen, you can see that in this example, the Wi-Fi signal strength was 92% and the latency from the device to the Wi-Fi router, Horizon desktop (HRZICP8A2), and to an external IP address (8.8.8.8), was 1ms, 2ms, and 19ms respectively.
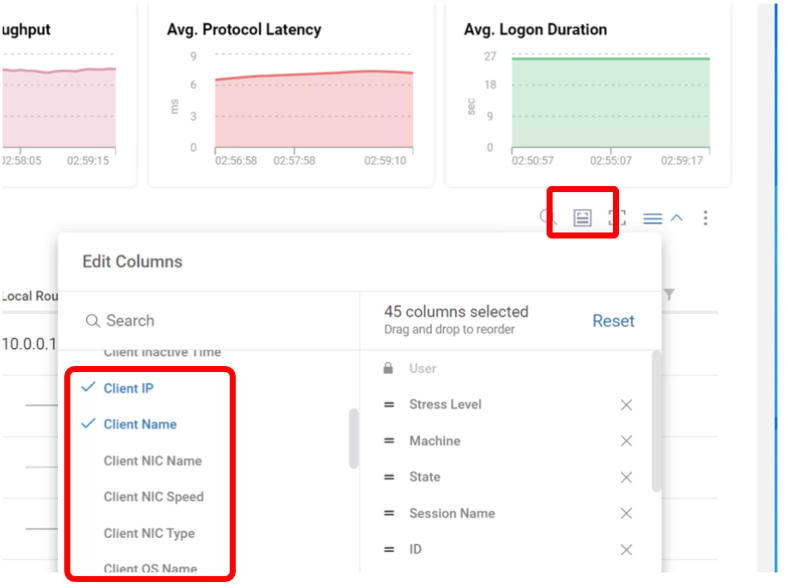
The Grid Column Picker provides additional information as needed.
Using Remote DX Metrics with Triggers
ControlUp Remote DX allows you to monitor clients, but when client metrics are coupled with triggers, they are even more powerful. With triggers, you can be alerted to issues in your VDI environment and, in many cases, automate responses to them. This makes it possible to correct problems automatically, rather than having to do it manually (or even miss them altogether).
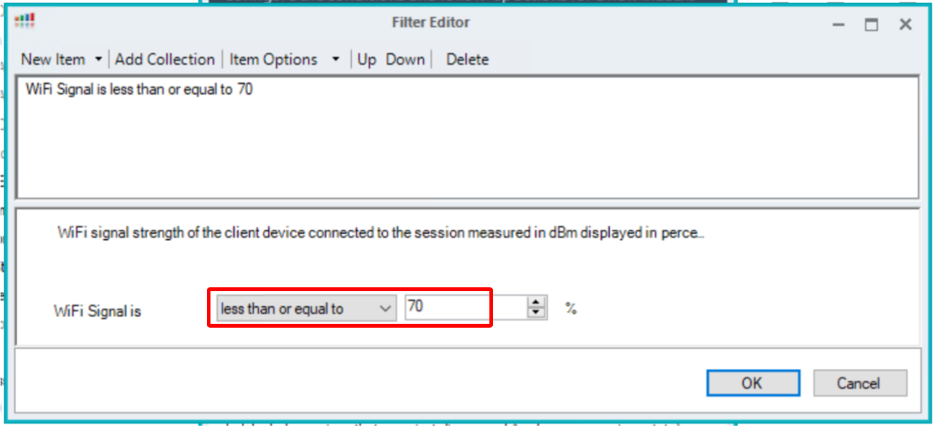
An example of how this works is to show how ControlUp alerts you when a client’s Wi-Fi signal drops below 70%. Although this is a trivial example, it will show you how easy triggers are to use.
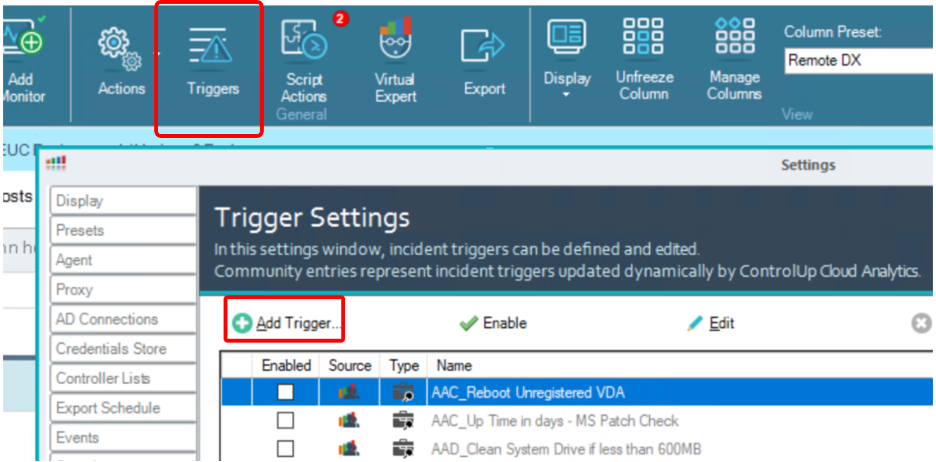
After logging into the ControlUp Real-Time Console, you can click the Trigger tab on the ribbon bar, and then click Add Trigger in the Trigger Settings dialog pop-up.
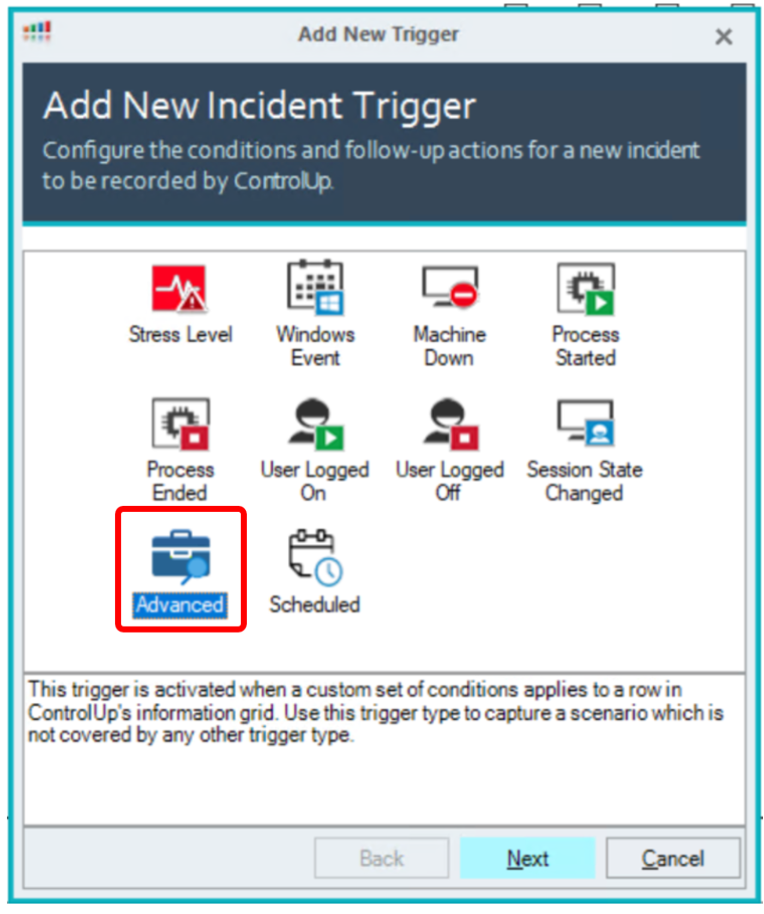
From the Add New Trigger dialog, select Advanced and click Next.
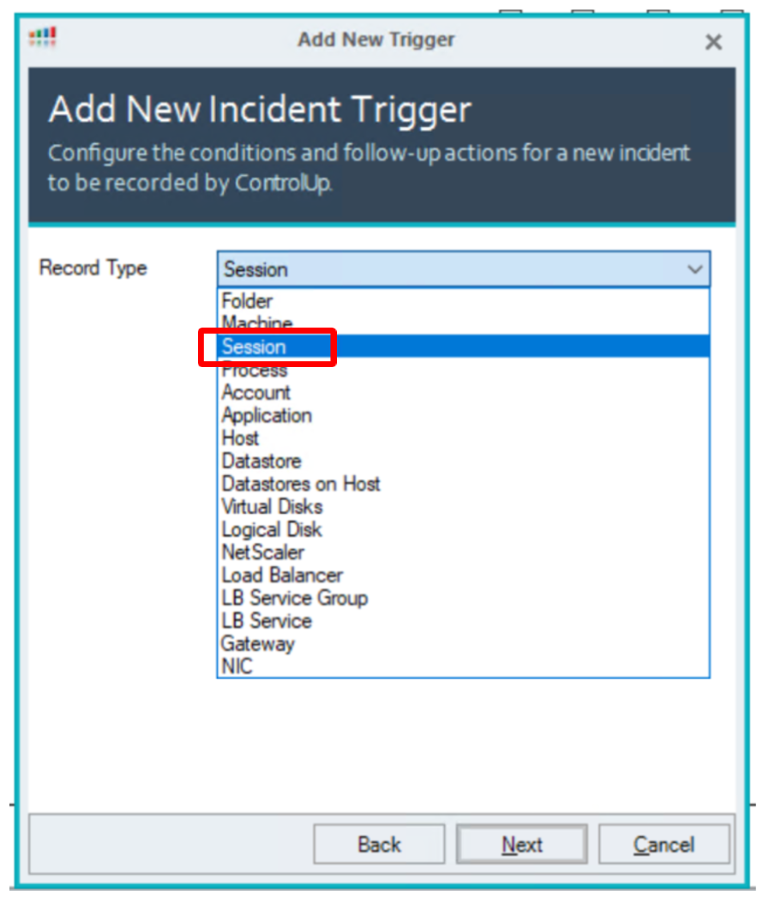
From the Record Type drop-down menu, select Session and click Next.
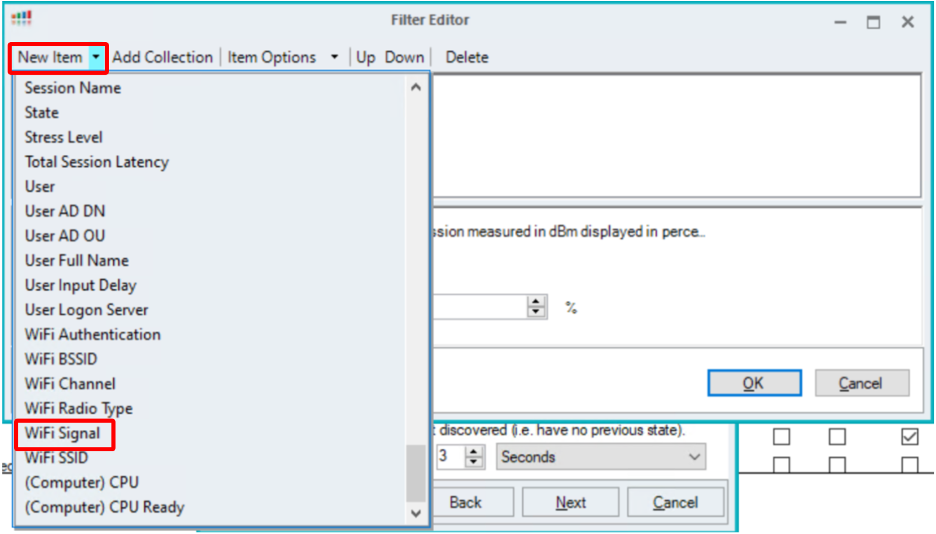
In the To This State box, select Filter Editor, then, after opening the New Item drop-down menu, select WiFi Signal.
The condition specified is a Wi-Fi signal of less than 70%.
Check “Include sessions that were just discovered” and set a minimum duration in the new state to 45 seconds.
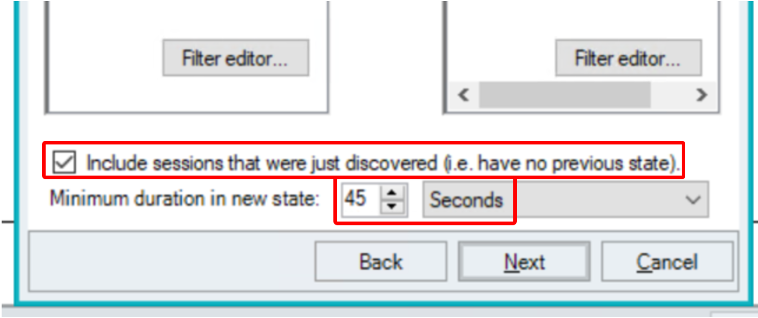
You can set the scope to your entire environment and specified to wait at least five minutes before rearming the trigger.
Finally click Add and set a follow-up action to play a sound on the console when the trigger was tripped.
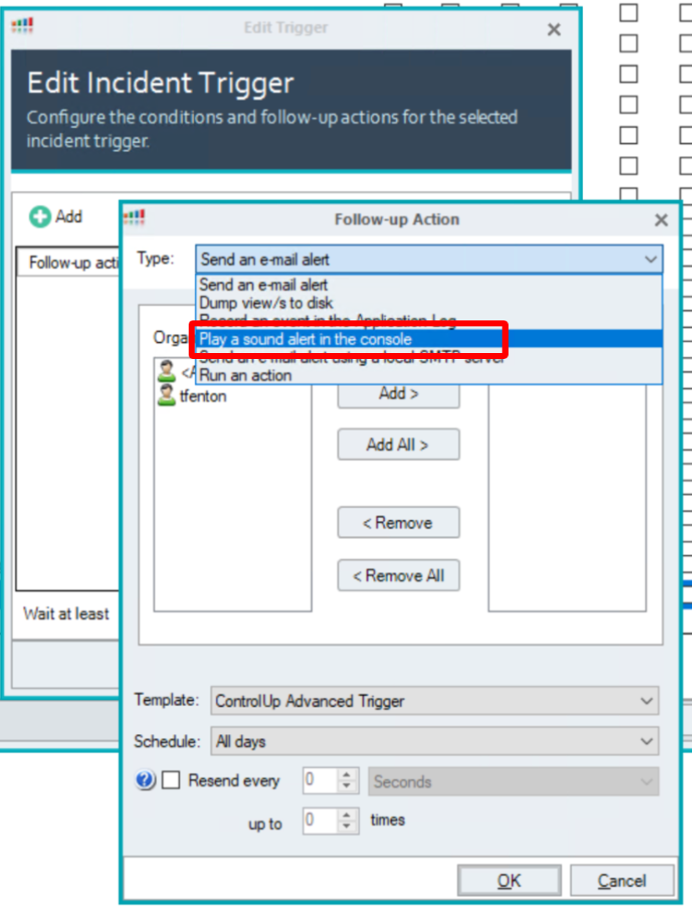
The same dialog helps you to configure a secondary action to email when the event occurred.

After watching ControlUp’s session at VMworld (EUS3057S) and seeing how the presenters degraded their Wi-Fi signal by placing their laptop in a microwave, one of our industry colleagues decided to try this on their own to see what would happen. In this example, the Wi-Fi signal dropped to 50%. In just 45 seconds, they heard the alert noise on the system where the ControlUp Real-Time Console was running, and received an email, alerting that the trigger was tripped.
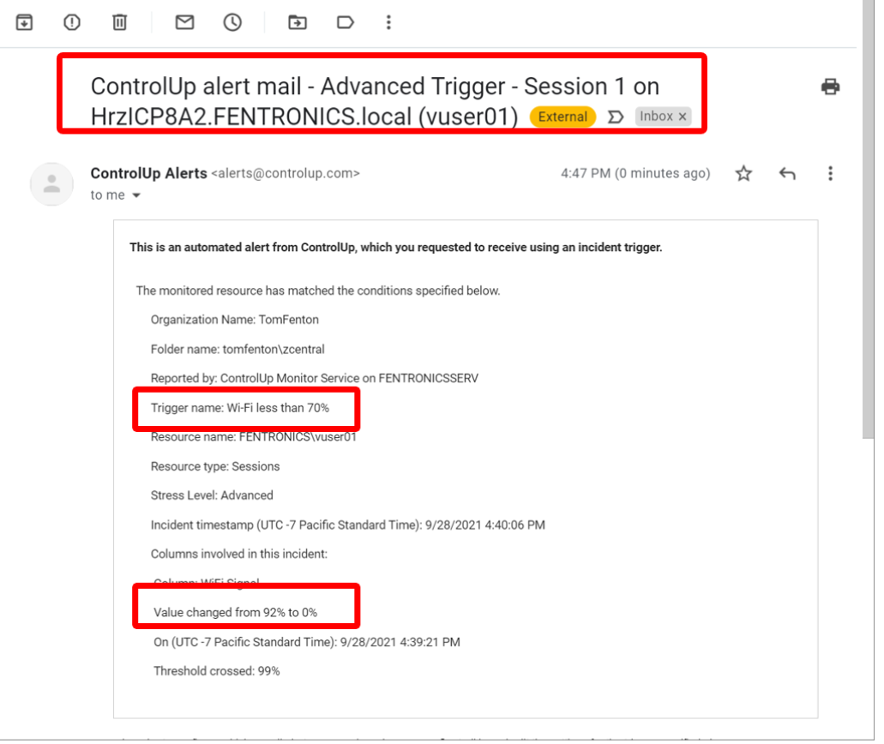
While this example uses an alert, can have just as easily specify a script action to be executed automatically. For example, you can set up a script to alert and drop a Horizon session if the WiFi Authentication is anything other than RSHA with PSK. This can ensure that remote workforce is following their corporate security guidelines.
Get Started with ControlUp DX and VMware Horizon
To get more information about ControlUp Remote DX, talk to your VMware sales rep, check out ControlUp’s Remote DX page, or download and install a 90-day trial of VMware Advanced Monitoring for Horizon Powered by ControlUp from the My.VMware.com portal.


