In vSAN for VMware Cloud Foundation (VCF) 9.1, we’ve taken an entirely new approach to capacity management that dramatically simplifies how capacity is presented to administrators. What does this mean for you? Clear and concise capacity reporting that tells you what you need to know, and in a way that you expect.
Let’s take a look at the new Effective Capacity view in vSAN for VCF 9.1.
Background
In all previous versions, vSAN rendered capacity information to the user in the form of raw capacity. When displaying available capacity, it aggregated all devices claimed by vSAN within the cluster and reported this as total capacity. For data stored in a vSAN cluster, it would display the space consumed for the data itself, as well as the additional data needed to make it resilient across the cluster. This amount of additional capacity varied because various storage policies could have different levels of capacity overheads.
Unfortunately, presenting capacity usage in raw form was not consistent with managing traditional storage, where overheads for resilience and other global metadata are built in and hidden from the administrator. vSAN administrators were faced with the task of ensuring additional overheads like resilience, global metadata, and free capacity requirements were properly accounted for. This sometimes made it difficult to know how much effective capacity a specific vSAN cluster provided.
New Clarity with Effective Capacity
vSAN in VCF 9.1 moves away from concepts of raw capacity, and presents storage capacity and consumption in a more intuitive and meaningful way. For all clusters with Auto-RAID enabled, vSAN provides a new capacity view that shows a cluster’s effective, usable capacity.
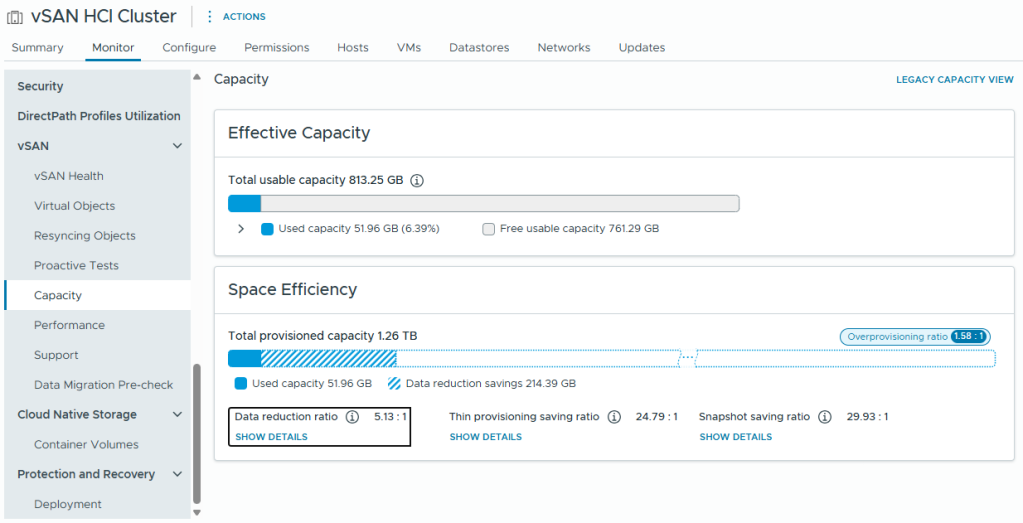
Figure 1. An overview of the new capacity view in vSAN for VCF 9.1.
The new capacity view is divided into two sections: Effective Capacity and Space Efficiency.
Capacity View – Effective Capacity Section
This section shows the total usable capacity of the cluster, in the form of a horizontal bar. It presents the total usable capacity after overheads are accounted for.
- Within that bar, the “used capacity” is the total used capacity, after space efficiency capabilities have taken place on the data stored.
- Within that bar, the “free usable capacity” presents the total remaining usable capacity, prior to any potential space efficiency. It does NOT attempt to forecast free usable capacity from opportunistic space efficiency features like compression and deduplication.
The view can also be expanded to see additional detail on the distribution of data stored.
Capacity View – Space Efficiency Section
The bottom portion of the new “Effective Capacity” view in vSAN will quantify how much space is regained using the specific type of opportunistic space efficiency feature. Capacity savings are provided for the following categories:
- Data reduction ratio
- Thin provisioning savings ratio
- Snapshot savings ratio
Each category can be expanded in the UI for additional levels of detail. For example, expanding on “Data reduction ratio” will show the discrete savings ratios for both deduplication, and compression.
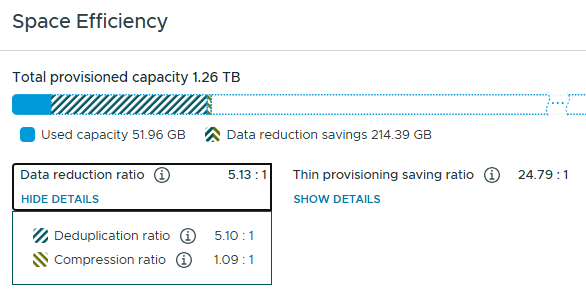
Figure 2. Space Efficiency details.
Note that these data reduction ratios may change as data is processed. For example, after vSAN writes a large amount of highly compressible data, the compression ratio may increase significantly. But after the deduplication process occurs, some of the data reductions originally occurring via compression will be replaced with deduplication to increase space savings. In this scenario, the compression ratio may decrease while the deduplication ratio increases. The overall data reduction ratio improves by using a combination of both techniques.
Improving on past versions, all space efficiency savings are expressed as a ratio, by stating a quantity of units of storage before the space efficiency feature followed by the quantity of units after. Examples include “4:1” “6:1” etc. A higher ratio equals more capacity savings than a lower ratio. More information on data reduction ratios can be found in the post: “Save Costs and Scale Efficiently with vSAN Deduplication in VCF 9.0.”
In addition to the capacity savings categories of “data reduction ratio,” “thin provisioning savings ratio,” and “snapshot savings ratio” the blue, horizontal bar will note the “overprovisioning ratio” on the right side of the image. This indicates that for physical storage provided by the cluster, one would need 1.46 times that amount if all the thin provisioned objects were fully provisioned.
Accommodating Free Capacity Requirements
The new way that vSAN renders storage capacity in VCF 9.1 automatically sets aside the appropriate amount of free capacity for operational activities and host failures. With the new Effective Capacity view paired with Auto-RAID, you can safely use all of the free capacity that vSAN advertises in the Effective Capacity view. This completely removes the need to factor in “reserved capacity” concepts (also known as “slack space” in much older versions) such as “operations reserve” and “host rebuild reserve.” Those mechanisms are no longer in the UI, as they were a construct of the previous approach to managing capacity in vSAN.
VM Capacity Consumption
Improved capacity views are not limited to just the cluster. The “provisioned space” and “used space” data associated with VMs in the cluster will now provide capacity consumption that is easier to digest, and will present capacity in a manner that is consistent with other storage systems.
Prior to 9.1, VM capacity usage shown in the vSphere Client would include the data stored and the additional data required to make it resilient. For example, a VM roughly 100GB in size would show the provisioned capacity as approximately 150GB if it was assigned an FTT=2 policy using RAID-6. This approach occasionally confused customers for both day-to-day operations as well as future planning and design, and was the reason for the post: “Demystifying Capacity Reporting in vSAN.”
In vSAN for VCF 9.1, VM provisioned and used space will reflect the provisioned and used space as seen by the VM. For example, that same 100GB VM noted above would show a provisioned size as approximately 100GB. The data remains fully redundant in accordance with the prescribed policy, but that is masked from the view to make it consistent with the cluster capacity views.
Requirements
The new effective capacity views require the use of Auto-RAID in vSAN for VCF 9.1. For clusters not using Auto-RAID, the legacy capacity view will be used. Auto-RAID is enabled by default on all new clusters, but can be enabled on upgraded clusters by changing the datastore’s default storage policy to “vSAN ESA Auto-RAID Policy.” Alternatively, you can enable the “Apply Auto-RAID to all objects” toggle in the cluster configuration. For more details, see the post: “Auto-RAID in vSAN for VCF 9.1 – Comprehensive System-Managed Data Resilience.”
For more information on the Effective Capacity view in vSAN for VCF 9.1, see the vSAN Availability Technologies, vSAN Space Efficiency Technologies, and vSAN FAQs documents.
Summary
The new Effective Capacity view in vSAN for VCF 9.1 takes some of the guesswork out of storage management by presenting clear, consumable information on usable space.
Discover more from VMware Cloud Foundation (VCF) Blog
Subscribe to get the latest posts sent to your email.