At VMworld 2016, VMware announced the newest release of their software-defined datacenter management tool – vRealize Operations Manager. At the VMworld keynote they demonstrated just a few of the impressive features of the new vROps version 6.3 and I heard that there were many more. I wanted to make sure that I checked out the additions for myself so I downloaded and deployed vROps 6.3 in my lab. Here’s what I found…
How to Deploy vRealize Operations Manager 6.3
If you’ve already deployed vROps, you know that vROps is a virtual appliance that you can easily deploy into your vSphere infrastructure. Of course you can (actually very easily) upgrade your existing vROps (I should blog about that as I did it and it was easy) but you probably want to just try the new 6.3 before upgrading.
Anyone can download vRealize Operations as a 60-day evaluation and deploy it into vSphere. Once downloaded, you can be up and running in under 10 minutes (as I was).
Once deployed, go through the quick start configuration-
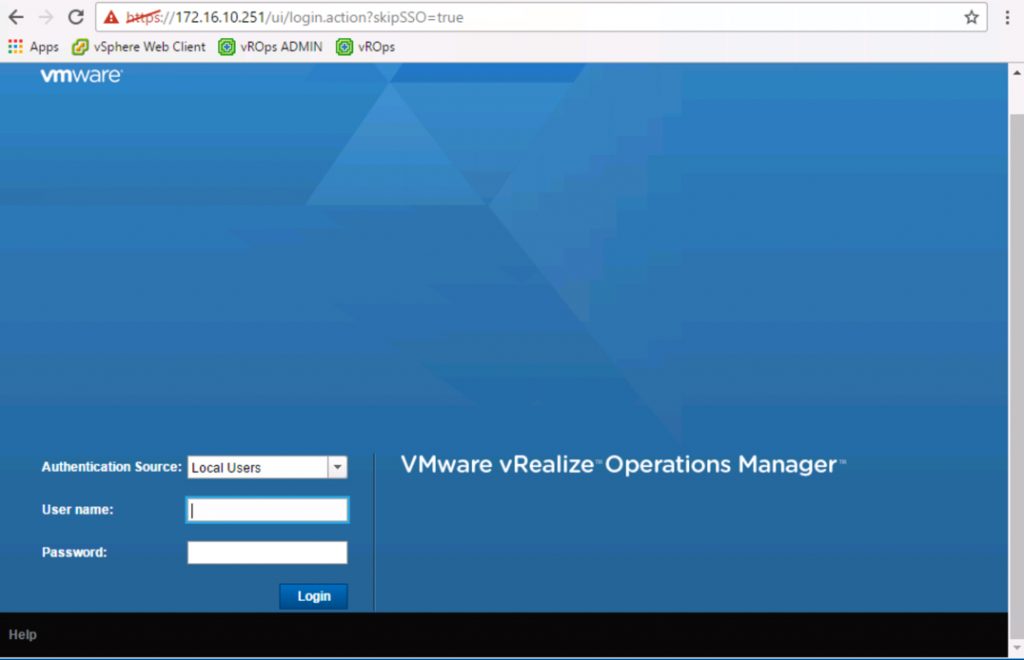
and you’ll be able to login to vRealize Operations 6.3.
So what’s new? Let’s talk about it.
What’s New in vRealize Operations 6.3
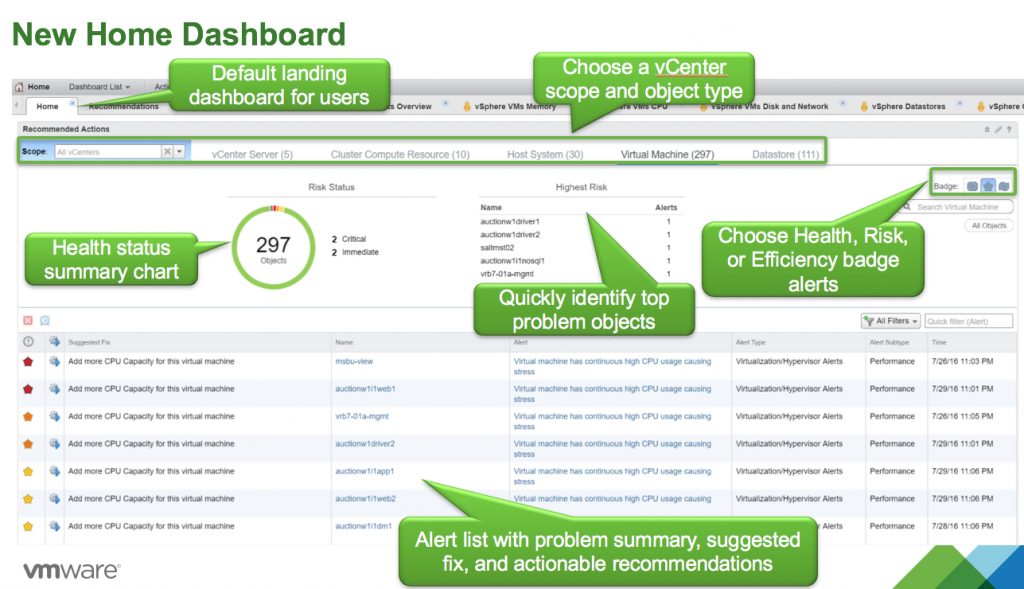
Immediately when logging into vRealize Operations 6.3, you’ll notice one of the most visible new features and that is the new home dashboard.
New Home Dashboard
To point out what the new home dashboard offers, here’s a screenshot from Henry Guo’s blog post – vRealize Operations 6.3: What’s New (hint it just got even better) – pointing out the new health status summary chart, the ranking of the highest risk objects, and the alert list.
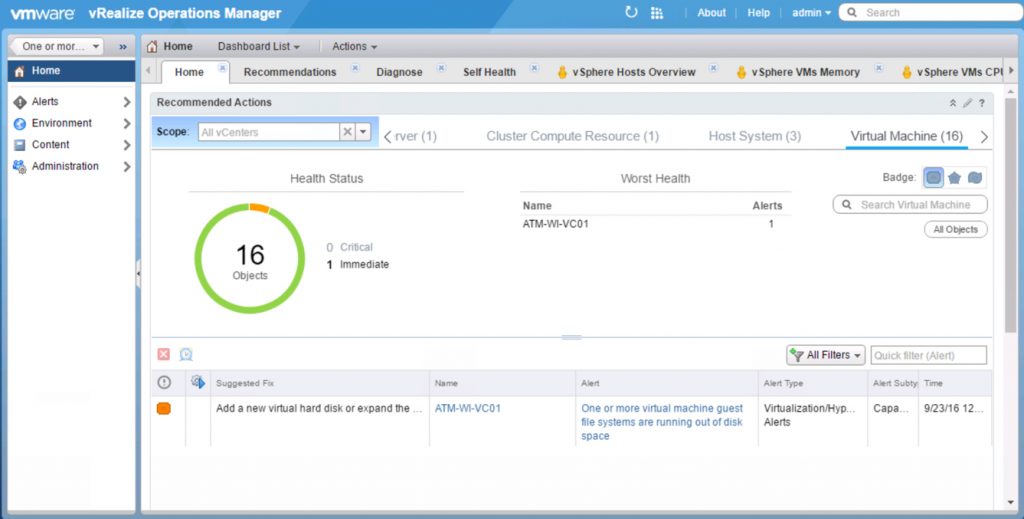
If there are actionable items from alerts, they can be acted on immediately from the new home dashboard. Here’s what my new vROps home dashboard looks like-
New DRS Cluster Dashboard
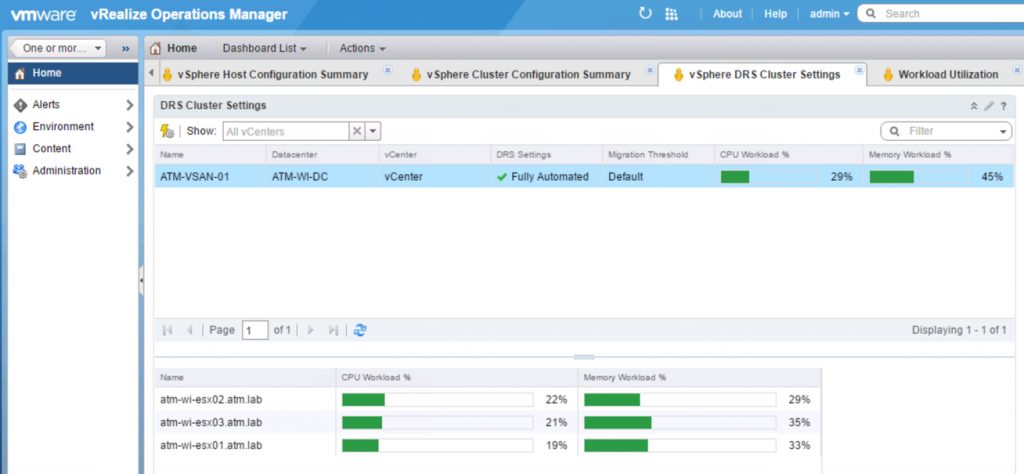
Another new feature is the DRS Cluster dashboard. This is a great new feature because there isn’t another place to go to analyze multiple DRS clusters all in the same place. Not only can you analyze multiple DRS clusters but you can set the migration threshold and automation levels, directly from vRealize Operations Manager.

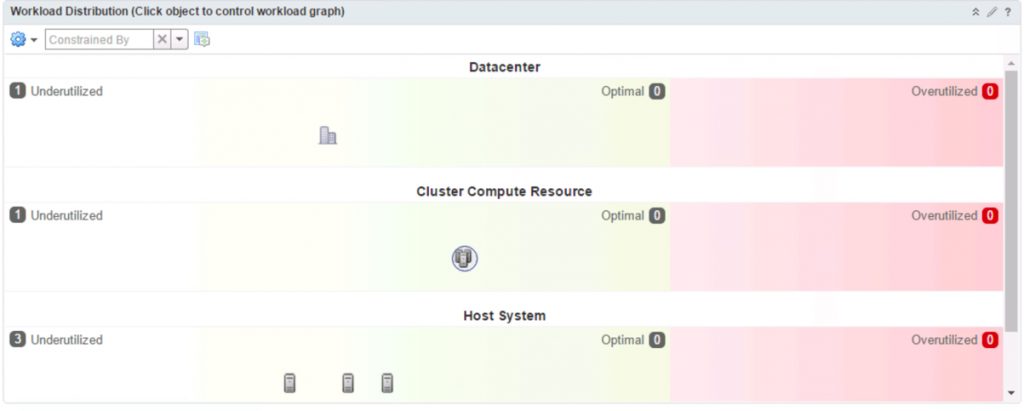
Workload Visualization
The new vROps 6.3 workload visualization can help you to see workload utilization / contention across across different dimensions including CPU, memory, and vSphere limits. It helps resolve workload contention by balance workloads across clusters. To be clear – DRS works to balance workloads (technically to ensure that a VM gets the resources that it needs) within a cluster and workload balancing works across clusters.
Here’s my workload visualization view-
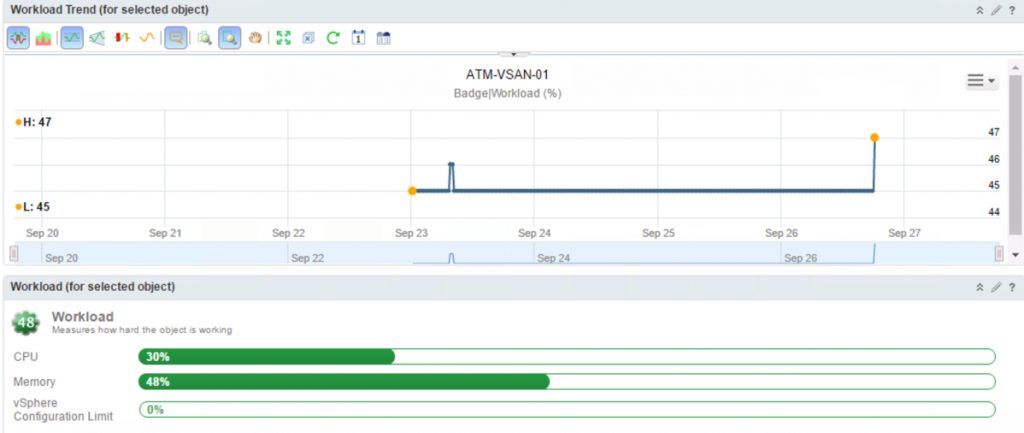
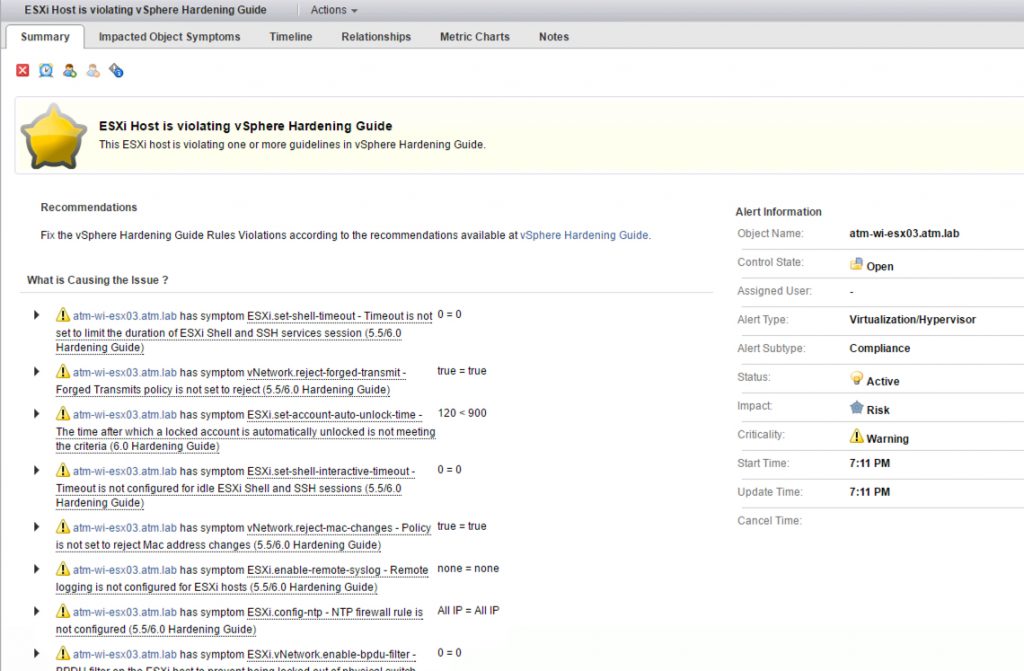
One of the best new features in vROps 6.3 is security analysis of the vSphere infrastructure based on the vSphere Hardening Guide. Previously this had to be done manually so being able to run an automated security analysis makes vSphere infrastructures much more secure (and saves time).
To enable this new feature, you have to go enable vSphere hardening guide alerts (you learn exactly how to do that here).

Once enabled, vROps will alert you when ESXi hosts and VMs are violating the guidelines in the vSphere hardening guide, as you see below.
When you click on the alert, you’ll see the cause of that alert and what you need to do to remediate it.
While I’m just getting started, I’ve been impressed with the new features in vRealize Operations 6.3.
You can learn more about vRealize Operations 6.3, in this video interview I did with VMware Product Manager, Hicham Mourad, below.
You can download a 60 day evaluation of vRealize Operations 6.3, here.


