If we want to know whether a child is sick, we measure fever. Sure, it’s not a perfect method, but a stuffy nose and the temperature are sufficient for a quick diagnosis. Usually we will not run blood analysis, computer tomography or microbiological tests. Although some doctors and mums may prefer to.
This is similar in the world of IT: we don’t allways need all possible details. Sometimes we don’t want to deploy and manage powerful monitoring agents. In some cases having a very basic performance information is sufficient.
Let’s take a look at a simple example. Unix based systems have plenty of commands to display the current health state of the system: uptime, w, iostat, vmstat, mpstat, netstat, nmon – just to mention some of them. In this example I will use the uptime command, runnig it periodically through the crontab and redirecting the output to the system logs. I am assumin that the system logs are forwarded – integrated to the Log Insight server either through the agent or directly.
So in the first step we just use “crontab -e” command and add the following or similar entry to the crontab:
*/1 * * * * /usr/bin/uptime | /usr/bin/logger
Crontab will run /usr/bin/uptime command every minute and redirect the output to logger. (Some distributions have different path for the uptime and logger commands: /bin/uptime and /bin/logger).
Now we should start seeing Linux uptime messages in Log Insight:
2016-05-17T11:23:01.980976+00:00 vcsa logger: 11:23am up 5 days 20:06, 1 user, load average: 2.09, 2.05, 1.88
or similar but slightly different from MacOS:
May 17 13:24:00 macmini baublys[5578]: 13:24 up 1 day, 51 mins, 2 users, load averages: 2.09 2.24 2.21
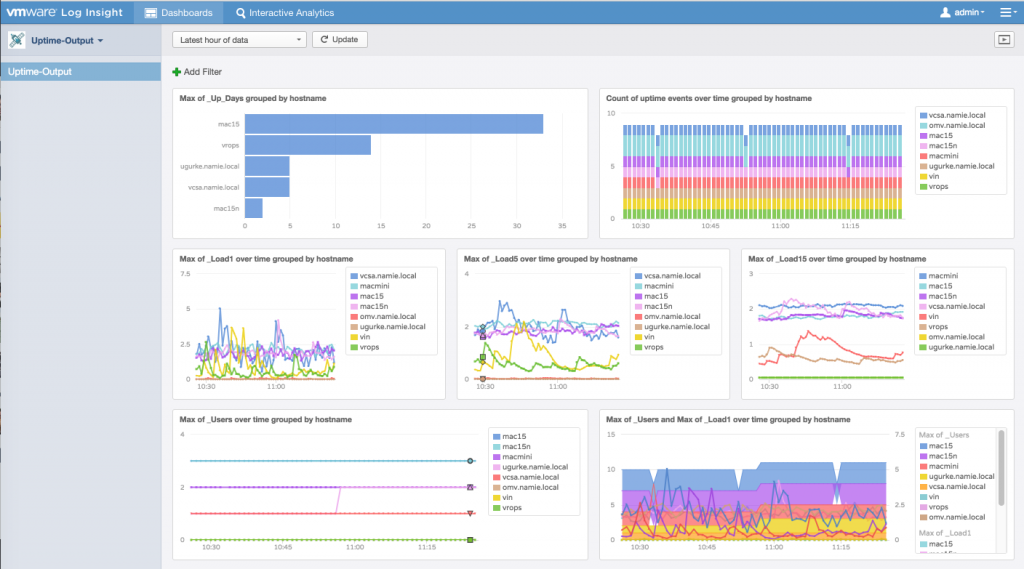
In the next step we just need to import this minimalistic content pack Uptime-Output-v1.2.vlcp_.zip unzip and install it. Choose the option “Import in to my content” in order to be able to edit and improve it without having to clone it. Once imported you will be able to see new fields extracted from the uptime command output. Then we can use it, for example, to correlate the number of logged in users with the load of the system:
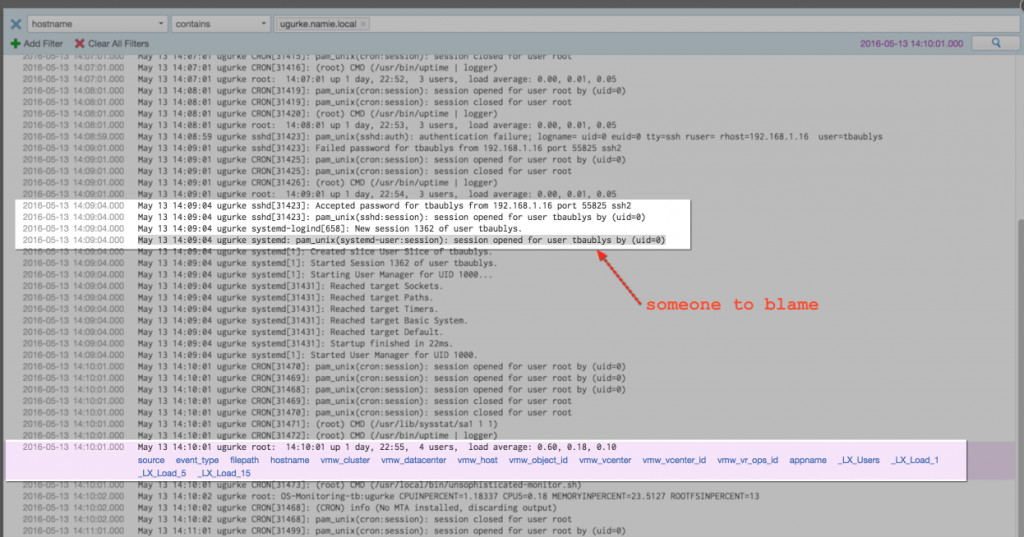
By viewing the events in context we may dig deeper and find out who logged in to the system. At least we will have a suspect:
Looking at the dashboard which was imported through the provided content pack, we will have a nice colourful overview about the systems integrated, providing us information on the load, uptime and logged in users. Keep in mind, that this is achieved with a single command in the crontab and minimal work on the Log Insight.
I hope this example will inspire you to collect additional information and to create your own monitoring dashboards. There are no limits for Log Insight.


