The all new vRealize Orchestrator 7.0 Content Pack for Log Insight has just been released. Anyone who has used the vRealize Automation 6.1+ Content Pack might recall there was a pretty basic dashboard for vRO workflow calls from the workflow stubs, but no in depth vRO queries. This new content pack provides thorough coverage for both standalone/clustered vRO appliances and the embedded version on the vRA appliance, including:
- Server Overview – get the status of all vRO hosts in your environment at a glance, including details of reboots and service state changes
- Workflow Failures – details about failed workflows by host, by workflow and error log events
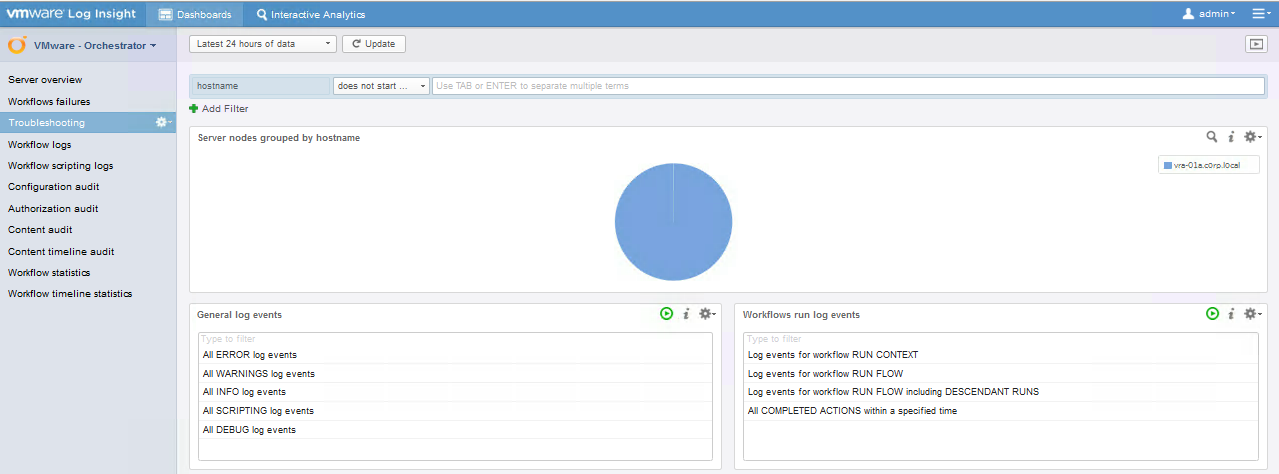
- Troubleshooting – provides two sets of queries for investigating general log errors and warnings, and workflow-specific logs for troubleshooting
- Workflow Logs – breaks down workflow info, warning and error logs by workflow name and token, user, and message type
- Workflow Scripting Logs – breaks down workflow scripting info, warning and error logs by user, workflow name and workflow token
- Configuration Audit – reports events for changes to boot, initial heap and max heap configurations
- Authorization Audit – reports on number of failed logins, failed login details by user and message, and provides license auditing
- Content Audit – tracks resource, workflow and configuration changes by host and over time
- Content Timeline Audit – content modifications by element type and change time, and detailed list of changed items over time
- Workflow Statistics – shows successfully completed workflows and workflow runs by host, workflow name, user name and combinations there of
- Workflow Timeline Statistics – shows successfully completed workflows and workflow runs over time and by end state
Continue reading to learn more about each of these…
Server Overview
The Server Overview dashboard provides the status of vRO nodes and state changes for hosts. It also shows server reboots and server state changes from standby to running, and vice versa.

Workflow Failures
The Workflow Failures dashboard will help you track down problem workflows by host, and see which workflows repeatedly fail. You will also find Error log events by workflow and over time.

Drilling into the FAILED workflows grouped by workflow name allows you to see the details of the log, but also gives you next steps for troubleshooting. In the sample below, you can see that the workflow token (unique identifier for a specific workflow execution) is tagged in the error log. Adding this field/value pair to the query is a simple step: hover over the field (vmw_vro_wf_token) below the event and select Value is ‘xxx’.

After adding the token field to the filter and removing all other filters, as shown below, you can see all logs related to this specific workflow execution. It’s pretty easy to spot the No route to host exception now! As it turns out, I intentionally powered off the Puppet host in my lab to force a failure. You can see that this is far more valuable, from a troubleshooting perspective, than the error logs showing the execution stack in the vRO client.

Troubleshooting
While we just walked through some troubleshooting steps, here in the Troubleshooting dashboard you will find more queries for investigating issues. The two sets of queries found here allow you to drill into general log events of different priorities and workflow runs. The Workflow run queries are set up with various parameters, ready for you to paste values in, after you open them in the Interactive Analytics tab. Context, for example, is used to trace vRealize Automation requests from the catalog through the various components, including vRO, for a more complete picture of logs related to a user request.
Workflow Logs
The Workflow Logs dashboard gives you a great view of workflow executions as it breaks down the logs by priority (info, warning, error) and by workflow name and workflow token (specific execution of a given workflow). In the example below, you can see that the Puppet workflows have had some issues (because I powered off the Puppet host in my lab). You will also see a breakdown of workflow warnings and errors per user and per message type.

Workflow Scripting Logs
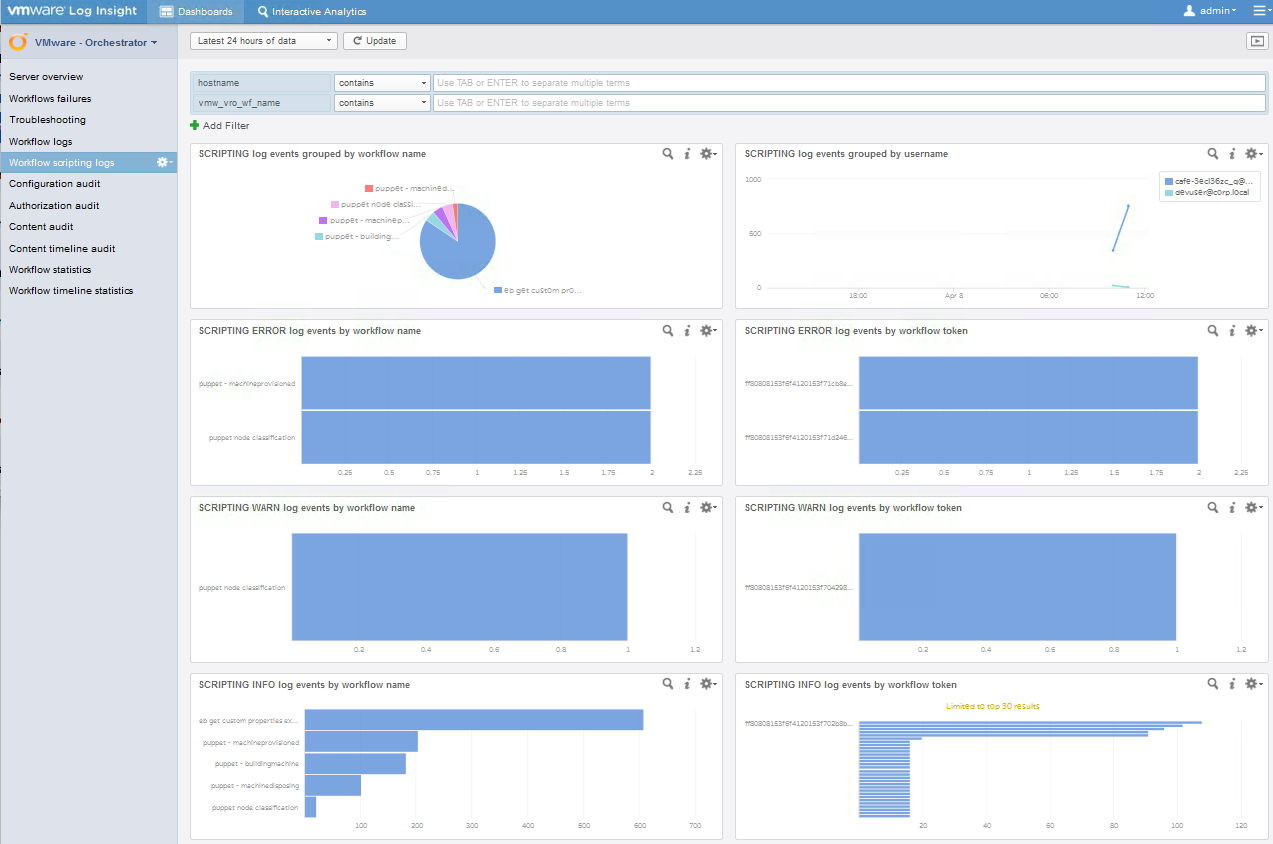
The Workflow Scripting logs are those explicitly written into the workflows by the workflow author, using the System.log (or .warn or .error or .debug) command. When thoughtful logging is applied during workflow authoring, these queries can be used to root cause intermittent issues.
Configuration Audit
The Configuration Audit dashboard allows you to trace changes to key system properties and changes to them. This can be helpful in troubleshooting your vRO environment or finding possible changes that have impacted it, such as vRA integration details (found by searching for “vro.cafe” in the results of the BOOT configuration query).

Authorization Audit
As the name implies, this dashboard focuses on Authorization issues (i.e. failed logins). In the examples below, the failure for [email protected] was due to an incorrect password while the failure for [email protected] was for an invalid user. You can also check all vRO nodes to see if any are using an evaluation license using the provided query.

Content Audit
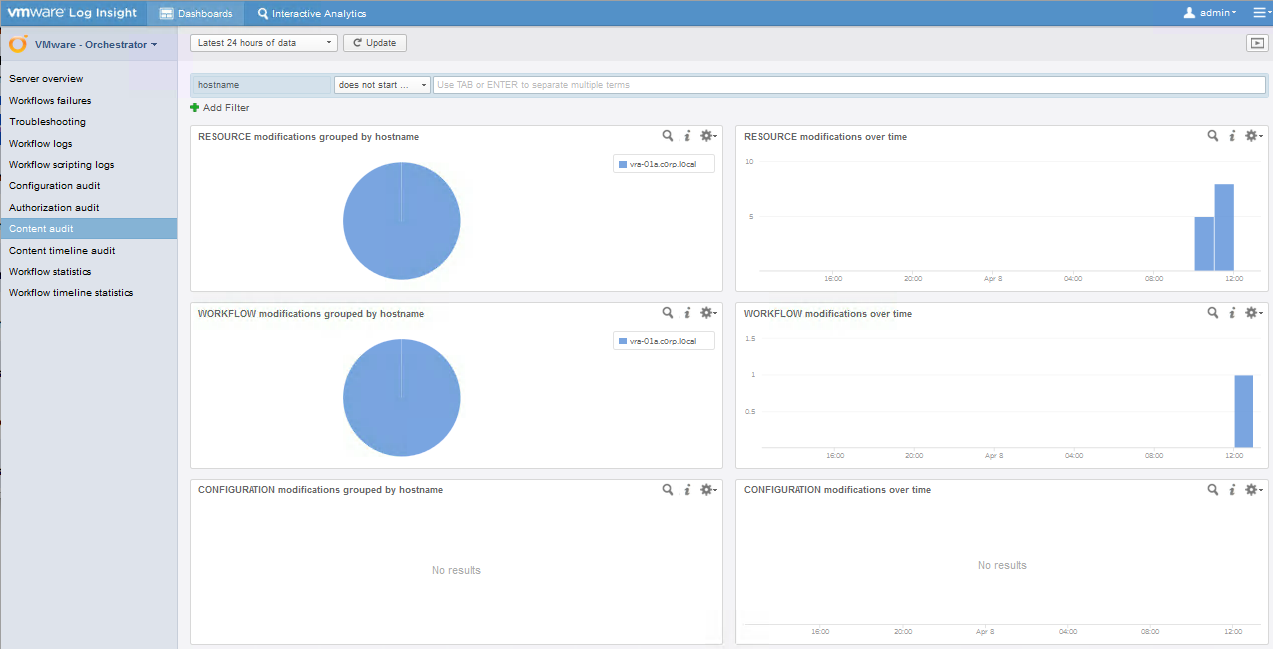
The Content Audit dashboard has great value in tracking modifications to resources, workflows and configurations, all per host and over time. This can be helpful, in a clustered vRO environment, to ensure updates such as workflow changes are made to all nodes. You can also use these queries to track down changes if a workflow suddenly starts to throw errors.
Content Timeline Audit
Tracking changes to workflows as well as resource elements (image files, scripts, XML templates, HTML files, etc used by any workflows or web views) can help root cause issues that suddenly appear or happen intermittently. The queries on this dashboard provide a view of changes to both workflows and resource elements on the same timelines.

Workflow Statistics
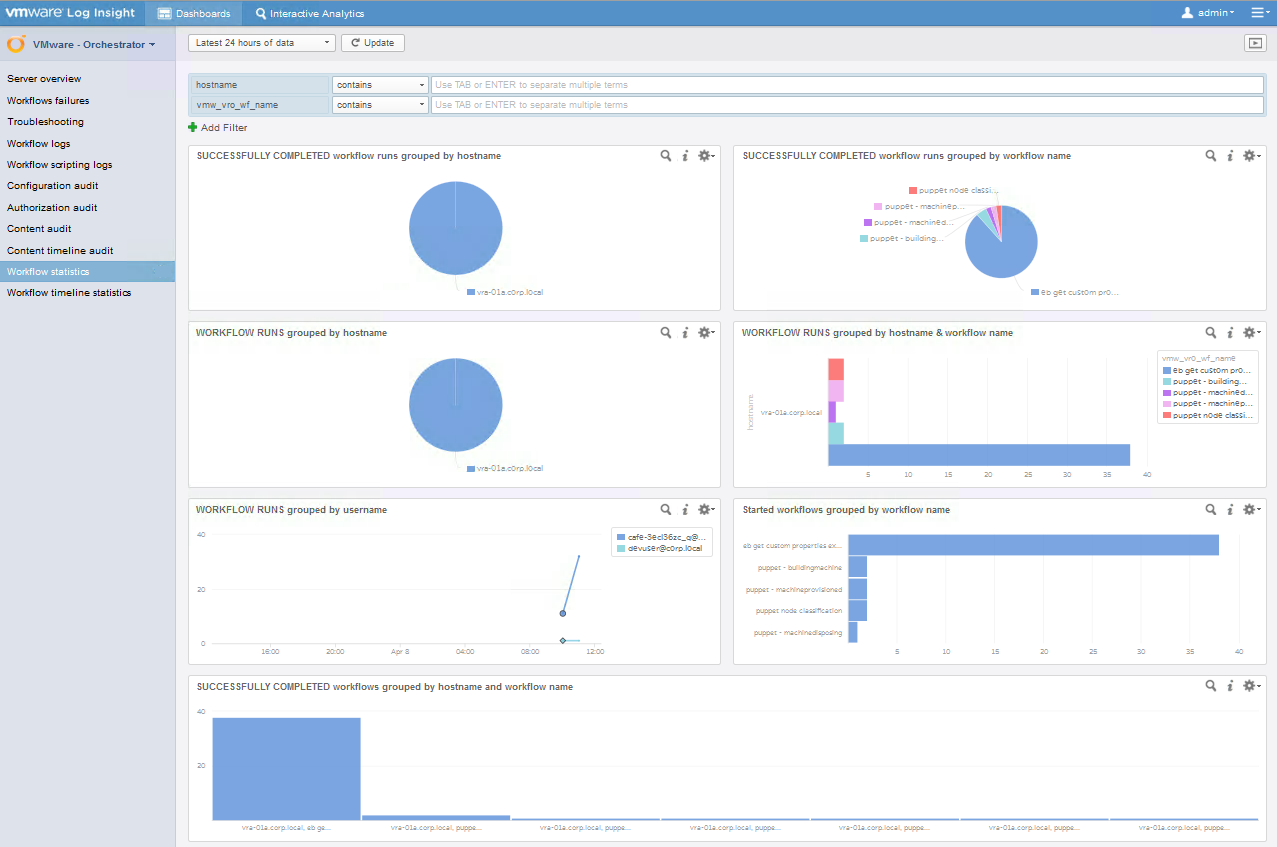
The Workflow Statistics dashboard has queries to track successfully completed workflows (with final state of successful) as well as workflow runs (workflows initiated, regardless of final state). These are grouped by various combinations of host, by workflow name, and user, and give you a sense of overall volume of execution.
Workflow Timeline Statistics
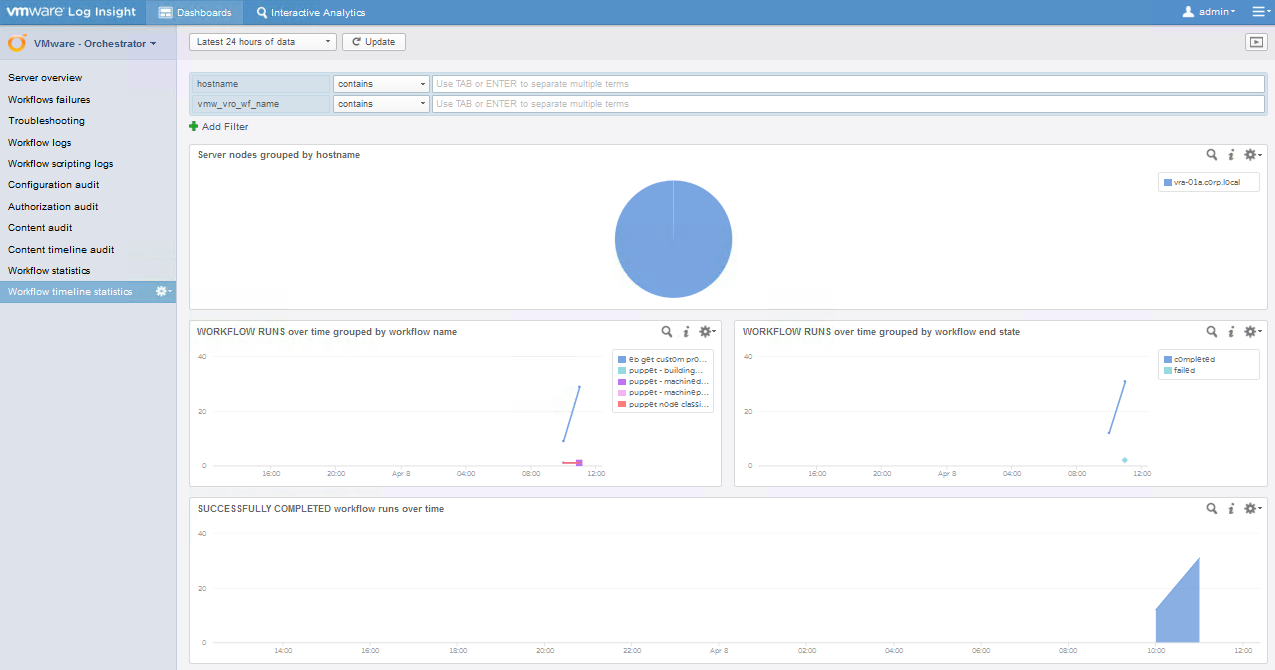
This dashboard shows similar information to the Workflow Statistics, but with different views so that you can compare, for example, the volume of workflow runs over time by workflow name, or the volume of workflow runs by end state (completed or failed).
Downloading and Configuring
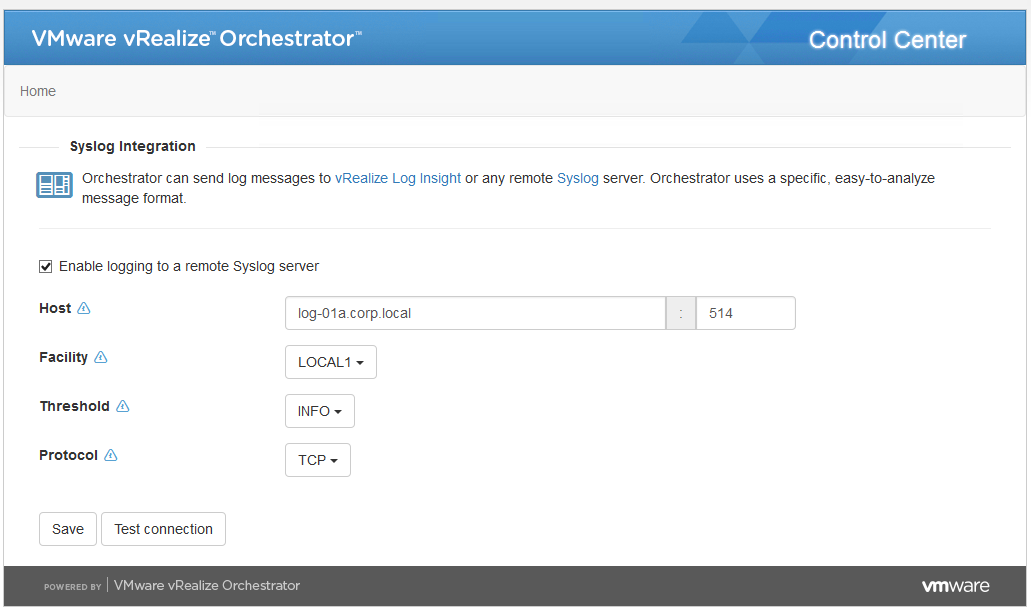
The vRealize Orchestrator 7.0 Content Pack for Log Insight is available from the in-product Log Insight Marketplace or on VMware Solution Exchange. Note that this release of the vRO 7.0 Content Pack is NOT compatible for use with the Log Insight agent. You should use the vRO Control Center (<hostname>:8283/vco-controlcenter) to set up the log forwarding (found under Log, Syslog Integration). Be sure to set the Threshold to INFO so proper logs are forwarded to Log Insight.
I hope you find this new vRealize Orchestrator Content Pack helpful in monitoring and managing your vRO and/or vRA environment! As always, feel free to leave a comment here or reach out to me via Twitter with feedback or enhancements. Happy Troubleshooting!

