 In my last post, I covered how you can view and test, first hand, how vRealize Operations and Log Insight can be integrated to work together in the VMware Hands on Labs (HoL). In this post, I’d like to explore some of the many new vRealize Operations, version 6.0, features.
While vRealize Operations 6 was announced at VMworld Europe around October of 2014, if you are super-busy like most IT people are then you may not have had the chance yet to download, install, and try out some of the new features first-hand (I know that was the case for me, up until recently). To familiarize myself with the new features, there were a number of resources that I used and I’ll list them out right from the start, below, because I’m sure that they’ll help you, just as they did me:
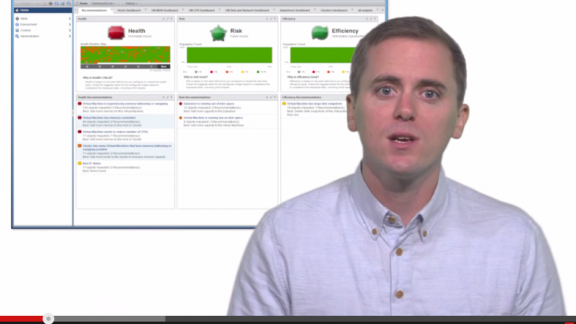
- VMware’s Cloud Management YouTube Channel which has 7+ videos just on the new vRealize Operations 6 and many more on the vRealize Suite (note that the video that you see above isn’t me – it’s Justin Smith, Staff Engineer at VMware.)
- vRealize Operations Download page
- vRealize Documentation page
- Blog – vRealize Operations 6 – Delivering Intelligent Operations from Apps to Storage by Himanshu Singh
Based on what I learned in the resources above, there are a LOT of new features to checking in vR Ops 6. For brevity, I checked out the following 5 new vRealize features and changes…
#1 Unified User Interface
In the past, there was the standard interface AND the custom interface. If you just wanted to use vROps (vCOps) and its standard feature set, you could easily do so. However, if you wanted to add some management packs to get vRealize Operations monitoring and analyzing some third-party hardware or software or you wanted to create some custom dashboards, you would use the custom interface. Having two different user interfaces caused confusion and delay and, thankfully, with the new vRealize Operations 6, there is now just a single, unified, interface. VMware has a nice new video on this unified interface and you can see it below.
My personal take on the new unified UI is that it make the product simpler to use and simpler to understand. Any time a product becomes simpler to use, the documentation around it, training around it, and community around it can thrive, more than ever before, because they have something that is now easier to use and understand, to “rally around”.
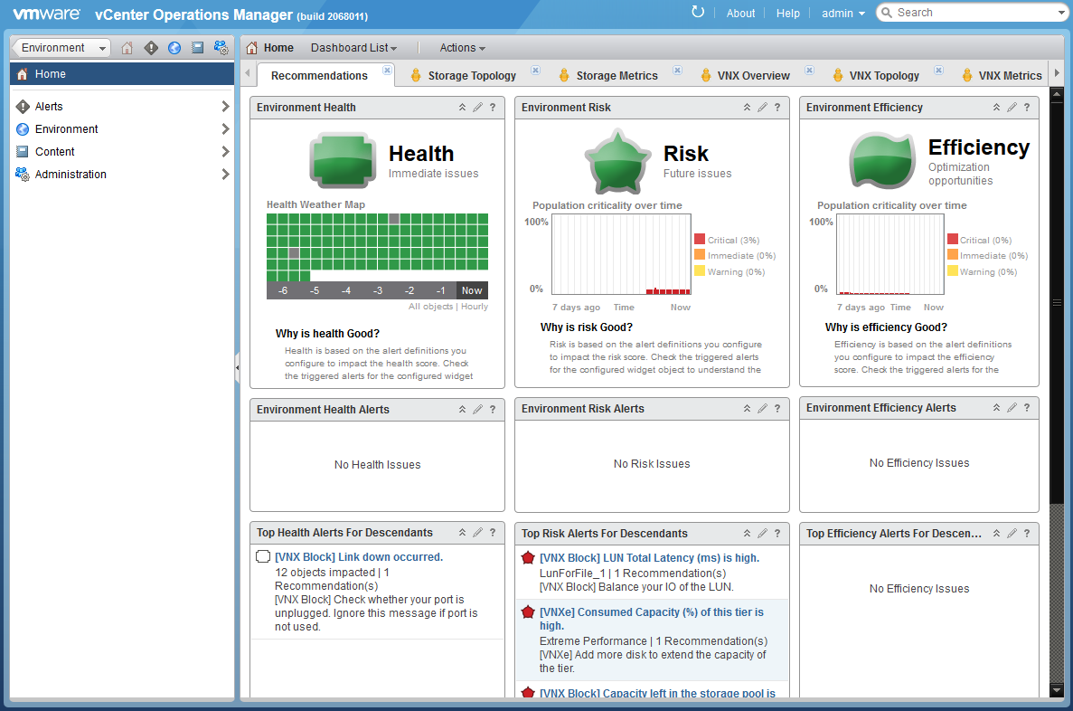
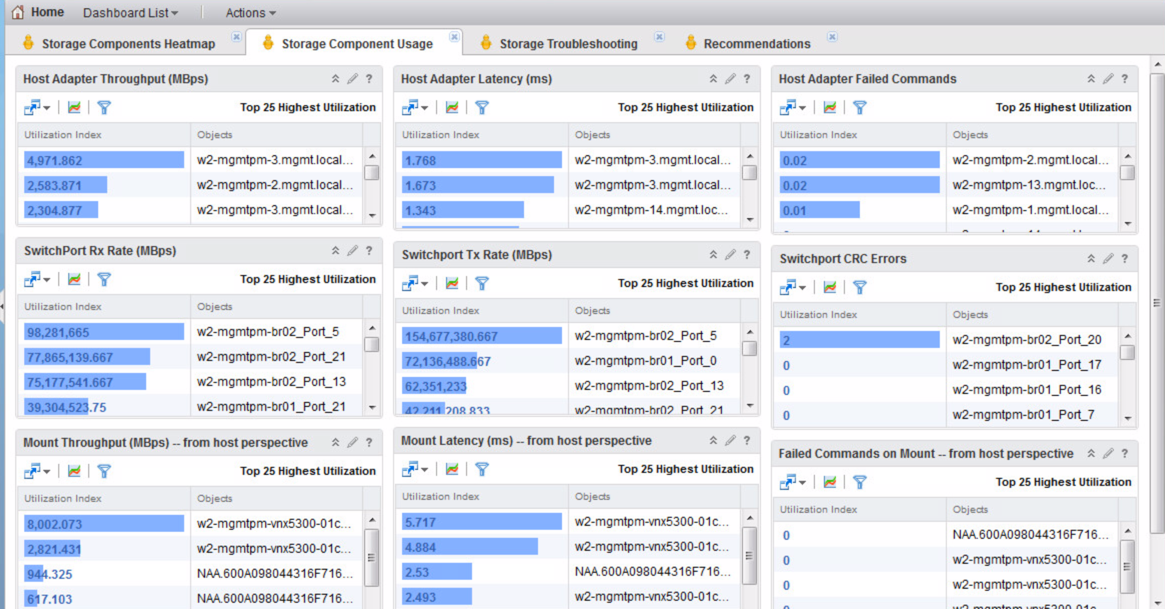
#2 Unified Storage Visibility
I’d bet that half of the vendors are VMworld 2014 were storage vendors. VMware released their new storage product, VSAN 6, now compatible with vSphere 6. All the excitement around storage is there for a couple of good reasons – #1 storage, more than ever before, is a critical piece of every vSphere infrastructure with infrastructure demands (IOps and capacity) expanding at alarming rates #2 storage vendors are innovating at breakneck speeds with new innovations around software-defined storage, caching, and flash-based storage/acceleration solutions. Software-Defined enterprise administrators must have complete visibility through the compute layer and into the storage and network.
Thankfully the new version of vROps 6.0 advanced now offers complete storage visibility, all the way down to the LUN level and adaptor level with statistics like I/O throughput and latency. Here’s my screeenshot of the new unified storage visibility from VMware’s hand-on-labs-
VMware’s YouTube channel short overview on unified storage visibility here.
#3 Unified Virtual Appliance
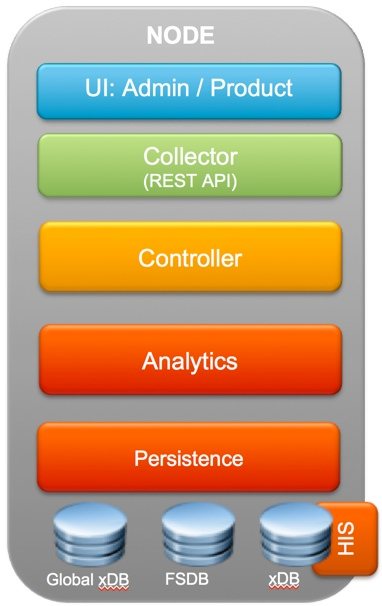 WIth so much unification going on – why not a single virtual appliance that can provide all vRealize Operations features? With the new vROps 6.0, instead of having a vApp with 2 virtual appliances inside, vROps is downloaded and deployed as a single virtual appliance that provides the user interface, collector (REST API), controller, analytics, and databases. But don’t worry! Just because it’s a single VM doesn’t mean that it can’t scale. When you deploy it, you’ll be asked what size of virtual infrastructure you want to monitor and, based on your answer, here’s how the vROps virtual appliance will be configured:
- Small Environments: 4 CPU, 16 GB Memory, 136 GB Storage
- Medium Environments: 8 CPU, 24 GB Memory, 136 GB Storage
- Large Environments: 16 CPU, 48 GB Memory, 136 GB Storage
Besides being simpler, the new design offers enterprises 8X greater scalability than before. What this means is that with a single VM vROps can manage/monitor many of the enterprises out there and should you have a large enterprise or need high availability, the new vROps scales easily into large vROps clusters (see the vROps 6.01 sizing guidelines and spreadsheet for more information).
#4 Intelligent Operations – Predictive Analytics and Smart Alerts
The whole reason that you are monitoring your datacenter infrastructure, operating systems, and applications in the first place is to ensure that nothing happens to them, right? You don’t want poor performance or downtime as these are your company’s most critical applications any poor performance or downtime reflects directly, or indirectly on you. Thus, the reasons to run vRealize Operations is to prevent poor performance and downtime and, if it does occur, “zap it” as quickly as possible to right the situation (aka remediate).
Thankfully the new vROps 6 has some great new features around predictive analysis and smart alerts. The idea with smart alerts is to greatly reduces your mean-time-to-resolution (MTTR) by showing you the root cause of a problem (as compared to an alert barrage from some monitoring tools) as well as recommendations on how to fix it and even an ‘Action’ button to resolve the issue immediately. vROps has out-of-the-box alert definitions created by subject matter experts on the virtual infrastructure storage, network, operating systems, applications and hybrid cloud deployments. You can also create custom alert definitions using a wizard-driven interface.
Here at the VMware Cloud Management blog, there was a great 4-part blog series covering smart alerts and you can find the 4 posts here (each with their own video):
Here’s a nice video that shows you how to use smart alerts to identify a performance problem and perform guided remediation –
#5 New Management Packs
With vRealize Operations 6, VMware has released more of their own and VMware partners have launched new vROps management packs to extend the functionality of vROps. You should know that management packs not only allow you to manage other hardware and software with vROps but the monitoring data from those objects is brought into vROps so that it can be stored, analyzed, and super-metrics can be created based on both existing vROps object analysis as well as the new objects accessible through management packs. For example, here’s
For example, the video below shows how you can monitor and analyze Cisco UCS servers with vRealize Operations 6 and the BlueMedora Cisco UCS management pack. Many more management packs are available in the VMware Cloud Management Marketplace.
Final Recommendations
In this post you have learned some of the top new features of vRealize Operations 6. If you’re like me, you’re a super-swamped IT professional and might be thinking “too bad I don’t have time to download and try vRealize Operations for myself”. If that’s the case, I recommend that you do what I did and see the new vROps 6 features for yourself, in less than about 10 minutes, through the magic of VMware’s Hand on Labs (HoL), specifically the vRealize Suite courses in the HoL catalog.


