Today, we announced the general availability of vCenter Log Insight 1.5. You can find the announcement by my colleague, Bill Roth, here. Our amazing engineering team put a lot of effort in creating this release, so I wanted to post a more detailed description of some of the newly introduced features and also provide more information about the technology behind Log Insight, even for some of the functionality that is not immediately visible to the user.
Support for Microsoft Active Directory based Access Control
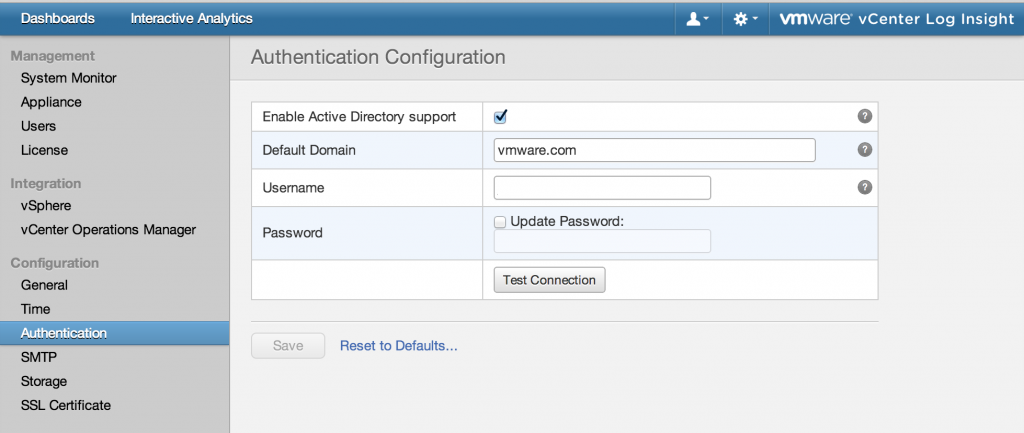
Using Log Insight in an Enterprise environment just became much easier – Log Insight 1.5 comes with support for authenticating users using Active Directory. The integration is extremely easy – all you need to do is enable Active Directory authentication and provide a user for validation.
A lot of effort was put in making the integration simple and easy. Log Insight automatically figures out how to contact the AD servers (no need to provide a hostname) and what are the optimal parameters. At the same time protects users credentials by defaulting to SSL based Kerberos authentication.
I would be very interested to hear if someone thinks that there is a simpler or more elegant implementation of AD integration.
Improved Performance for Frequently Executed Queries and Dashboards
Log Insight 1.5 users should expect to see much faster loading of dashboards and also faster response times for frequently executed queries – up to 10x faster! We do this by introducing several technological innovations that are not directly visible to the user.
Log Insight constantly computes the “top-k” queries – aka the most frequently executed queries (from Interactive Analytics or Dashboard pages) – using approximation algorithms. By utilizing idle system resources it constantly optimizes the execution of the “top-k” queries for old and new data. This way when a user tries to load a popular dashboard page, all the charts load immediately.
New Analytics Function: Unique Count (ucount)
Log Insight introduces – or rather reintroduces for those of you that have used early previews of the product (pre 1.0) – the Unique Count function for more powerful analytical queries. The ucount function enables the calculation of very useful statistics, such as:
- The number of scsi devices that have encountered high latency over the last 24 hours (ucount of scsi devices when scsi latency > 100ms)
- Send an alert when the number of devices logging to Log Insight drops below a certain number (ucount of hostnames –> create alert)
Calculating the Unique Count of a certain field can be extremely demanding in terms of resources – CPU, IO and Memory. The reason is that we need to examine every match in order to classify it in one of the unique groups – knowing that you have 1,000 hostnames in your search results is not sufficient, you have to examine each value and see if it’s unique or if it has already been seen. This requires both a lot of processing capacity but also enough memory to store all the unique values. Log Insight 1.5 uses probabilistic data structures to store the values bounding thus the maximum memory while providing very high accuracy for the vast majority of calculations. Our approach makes ucount function much faster than simple, existing implementations.
Improved Content Pack Framework
Content Packs are collection of predefined Dashboards, Alerts, Queries, etc. that Log Insight 1.0 admins have the ability to download and install providing best practices for all sorts of data. In Log Insight 1.5 we significantly improved and extended the Content Pack Framework making it even easier to create content but more importantly to utilize best practices that vendors and expert users put together. New features in 1.5:
- Content Pack authors can easily select a subset of their content (dashboards, queries, extracted fields, etc.) and export it as a Content Pack. Also, they can easily reimport their existing Content Packs if they want to improve and re-release them.
- Content Pack authors now have the ability to brand their Content Packs (author, logo, URL, etc.).
- Users – in addition to admins – can now import Content Packs into their user space. Also, users and admins can select a subset of a Content Pack and import it, e.g. just a single Dashboard or a bunch of alerts. Log Insight automatically figures out all the dependencies and imports just what’s necessary
- Every time the definition of a field changes, Log Insight automatically updates all the charts/dashboards that use the field.
With Log Insight we pay a lot attention to making the product easy to use. I feel that our approach with Content Packs makes that clear. Not only the users can easily import and use useful content such as Dashboards and Extracted Fields but authors can create Content Packs with a few clicks – no need to learn a language or design UIs for dashboards, just use the product, create the content and then export it using the export wizard.
Log Insight comes with the vSphere Content Pack pre-installed, providing the best practices for collecting troubleshooting and analyzing your Virtual Infrastructure logs. You can also download a lot more Content Packs for your Storage, Network and Application logs from the Log Insight Content Marketplace
Even better Integration with VMware vSphere and vCenter Operations Manager
Log Insight 1.5 comes with a very comprehensive Content Pack for vSphere providing the best practices for managing and troubleshooting your Virtual Infrastructure from the engineering team that has built it. It also makes integration and log collection from ESXi hosts extremely easy. It features a wizard for configuring which hosts you want to collect logs from as well as for enabling collection of Alarms, Events and Tasks from your vCenter Servers.
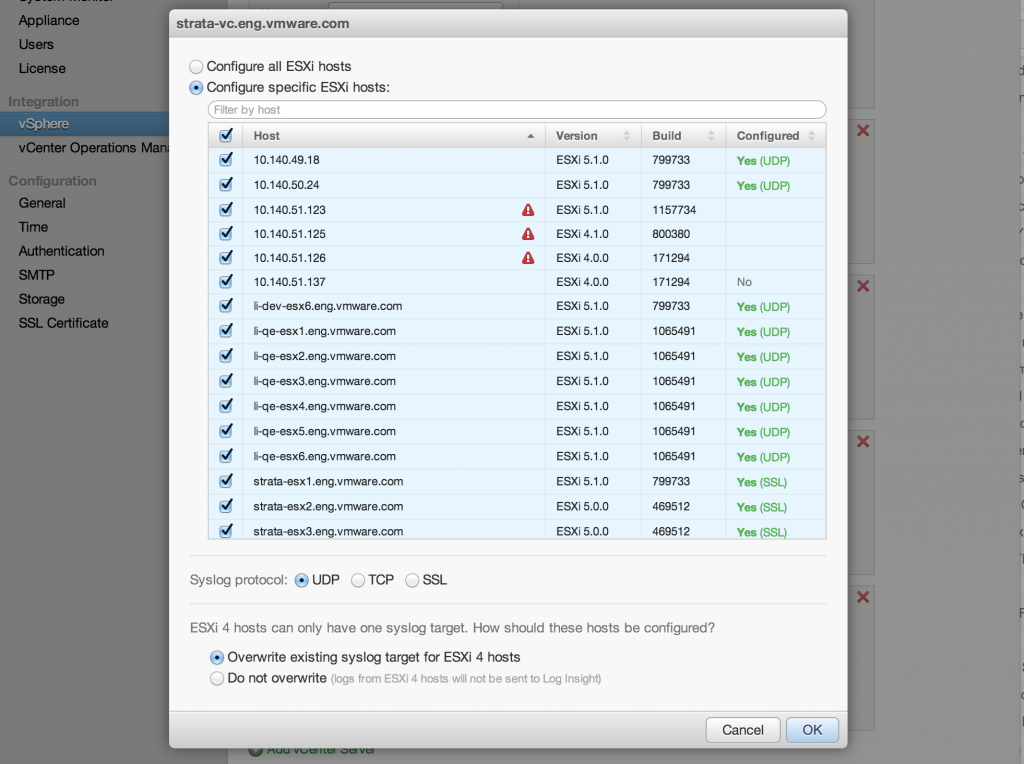 Most of the Log Insight users are also using the vCenter Operations Management Suite. Log Insight 1.5 in conjunction with vCenter Operations Management Suite 5.8 that was released in December of 2013 introduce several integration improvements:
- Using vCenter Operations Suite 5.8 you can launch Log Insight in context (view relevant logs for any given object) from charts
- When launching Log Insight from vCenter Operations users view a more precise time range of their data
- Finally, there is brand new Content Pack for troubleshooting vCenter Operations 5.8 using Log Insight: https://solutionexchange.vmware.com/store/products/vcenter-log-insight-content-pack-for-vcenter-operations-manager
Log Insight, among others, aims to be the best log management solution for VMware and Cloud Infrastructure more generally. We have incorporated years of experience into our Content Packs and we will keep constantly improving and extending them while covering more and more products.
Finally – Lots of Usability Improvements
Log Insight 1.5 introduces tens of small but significant usability improvements – things that we believe make the experience of using Log Insight pleasant. Just to mention a few:
- UI based in-place upgrades: just click upgrade and upload the newly released version – Log Insight takes care of everything else
- Easier deployment as the user now has the ability to select if she needs a Small, Medium, Large or Extra Small (for laptops) installation with guidance on what capacity each one provides during installation.
- Improved Health Monitoring of the Log Insight Virtual Appliance. This should help Log Insight admins easily discover issues that might affect the performance of the product, e.g. low NFS throughput that delays archiving or resource pressure that might lead to suboptimal performance
Useful Resources
The Log Insight product team is very open to receiving user feedback and improving the product accordingly. Below are some ways to contribute your feedback, suggestions and ideas:
- Create an account in our idea exchange community, submit ideas and vote the ones you would like to see in the product: http://loginsight.vmware.com/?signup=1
- Post questions and feedback in our community: https://communities.vmware.com/community/vmtn/vcenter/vcenter-log-insight
- Follow us on Twitter and stay up to date: http://twitter.com/vmloginsight

