This month, we published nine new VMmark 4 benchmark results from Hewlett Packard Enterprise and Supermicro that demonstrate the performance and scalability of the new AMD EPYC™ 9005 Series Server Processors powering vSphere 8 hosts. You can view the results in context on the VMmark 4 Results page, but this blog highlights the key points.
VMmark 4
VMware VMmark 4 is a free cluster-level benchmark that measures the performance and scalability of enterprise virtualization environments. If you’d like to learn more about VMmark 4, refer to Introducing VMmark 4: A modernized private cloud server consolidation benchmark and VMmark Product FAQs.
One important point: a VMmark tile consists of 23 VMs running a variety of diverse workloads ranging from traditional Java and database workloads to Kubernetes, Docker containers, NoSQL, and social network workloads common in modern enterprise data centers.
Supermicro benchmark results
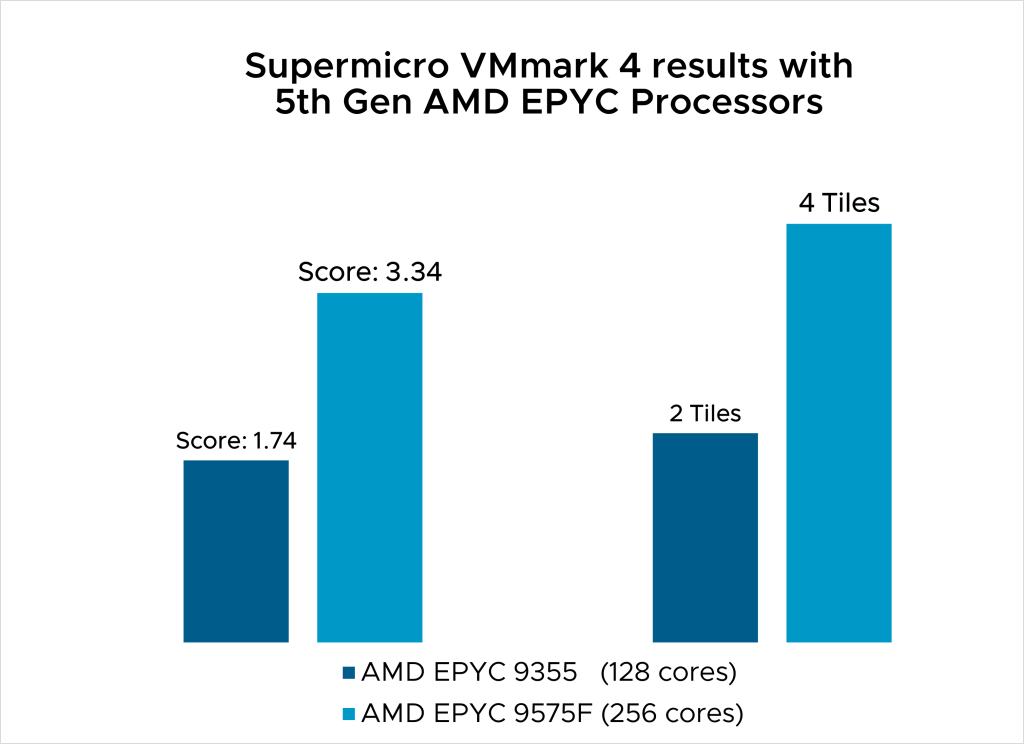
This first comparison demonstrates how well these new processors scale using VMmark 4 and the latest VMware ESXi hypervisor when doubling the total number of cores from 128 to 256:
| Processor model | vSphere version | Total hosts | Total sockets | Total cores | VMmark 4 result |
| AMD EPYC 9355 | 8.0 U3 | 2 | 4 | 128 | 1.74 @ 2 tiles |
| AMD EPYC 9575F | 8.0 U3 | 2 | 4 | 256 | 3.34 @ 4 tiles |

As you can see from the table and graph above, the result with 256 cores is 1.9x higher than the 128-core result, and twice the number of virtual machines (tiles) were running throughout the 3-hour duration of the VMmark benchmark.
Hewlett Packard Enterprise benchmark results
HPE has three VMmark 4 results published to date, all of which use four hosts configured as a VMware vSAN ESA cluster:
| Processor | vSphere Version | Total Hosts | Total Sockets | Total Cores | Result |
| AMD EPYC 9654 | 8.0 U2 | 4 | 8 | 768 | 6.66 @ 8 tiles |
| AMD EPYC 9655 | 8.0 U3 | 4 | 8 | 768 | 7.36 @ 8 tiles |
| AMD EPYC 9845 | 8.0 U3 | 4 | 8 | 1280 | 9.67 @ 12 tiles |
The first result uses previous generation EPYC 4th Gen processors (denoted by the processor model ending in the number “4”). Despite the same core counts in the first two results, the 5th Gen processors improve performance by over 10%.
When you compare the previous generation’s result to the one with 1280 cores, it’s a whopping 45% higher!

Here are some resources to learn more:
VMmark is a free benchmarking tool used by hardware vendors and others to measure the performance, scalability, and power consumption of virtualization platforms. It has become the standard way to evaluate the performance of virtualization platforms. Visit the VMmark product page and VMmark Community for more information.
Discover more from VMware Cloud Foundation (VCF) Blog
Subscribe to get the latest posts sent to your email.


