

Cloud-native applications bring flexibility, scale, and faster delivery, but they also introduce new operational complexity. In Kubernetes environments, workloads are ephemeral, services are distributed, and telemetry is generated at high volume across multiple layers of the stack.
Our new Observability on vSphere Kubernetes Service white paper explores how to address this challenge on VMware Cloud Foundation (VCF) with vSphere Kubernetes Service (VKS).
The paper walks through a practical reference architecture built around the following three pillars of observability:
Metrics
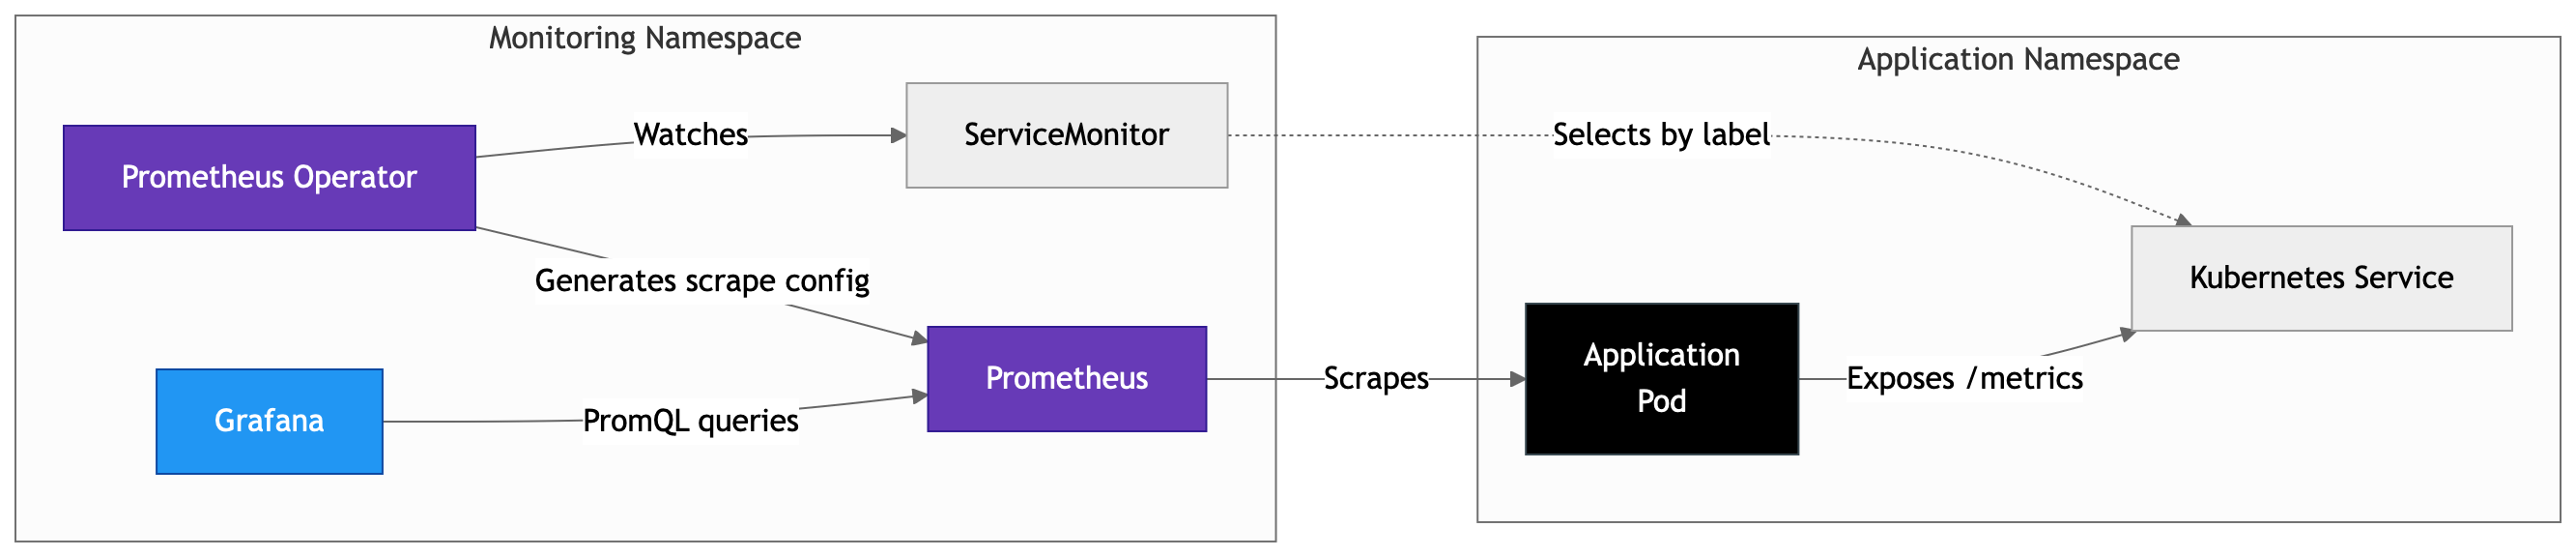
For metrics, the architecture uses the Prometheus Community Stack (kube-prometheus-stack), which includes Prometheus Operator for dynamic target discovery, Grafana for dashboards, and Node Exporter for node-level statistics. Metrics are further enriched with Istio service telemetry and connected to VCF Operations to provide underlying infrastructure context.
Logs
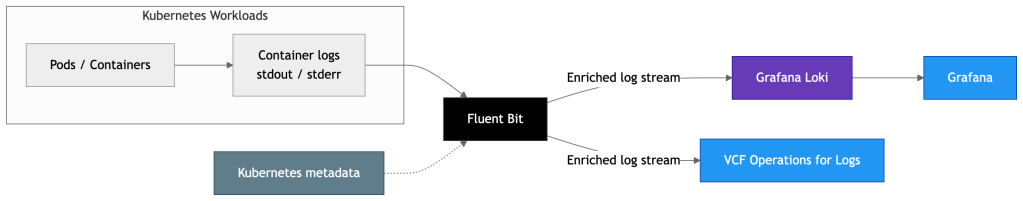
For logs, Fluent Bit is used to collect and enrich Kubernetes log data, with Grafana Loki providing storage and indexing for Kubernetes-native log exploration in Grafana. The same log stream is also forwarded to VCF Operations for Logs, enabling correlation with the wider infrastructure landscape.
Traces
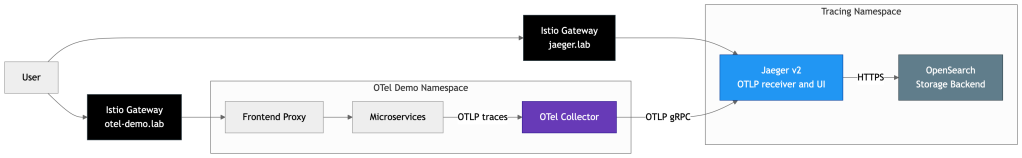
For traces, OpenTelemetry is leveraged for distributed tracing, Jaeger v2 to ingest and visualize OTLP trace data, and OpenSearch as a persistent trace backend. This allows request flows to be followed across services and analysed alongside related application and platform telemetry.
Read the white paper here:
https://www.vmware.com/docs/observability-vks
View the accompanying repository here:
https://github.com/vmware/vks-consumption-models/tree/main/observability-consumption-model
For teams running vSphere Kubernetes Service on VMware Cloud Foundation, this paper offers a practical starting point for building a modular, production-oriented observability stack.
Discover more from VMware Cloud Foundation (VCF) Blog
Subscribe to get the latest posts sent to your email.


