

The VMware Cloud Foundation (VCF) 9.0 release introduced significant updates in VCF Operations including the troubleshooting capabilities. Now the Network Operations Center (NOC), site reliability engineers (SREs), and application teams can quickly detect issues (e.g. improving MTTI and MTTR) and identify RCA, thus improving their effectiveness.
Here, we will look at different use cases and see how different admin personas can benefit from the new integrated interface of VCF Operations 9.0.
Infrastructure Teams: I have a large VCF fleet with multiple VCF instances across GEO locations. How can I manage the entire fleet from one place?
When you log in to VCF Operations, you will first be greeted with the Overview page. This is a great start to view a summary of all your VMware cloud accounts monitored in VCF Operations:
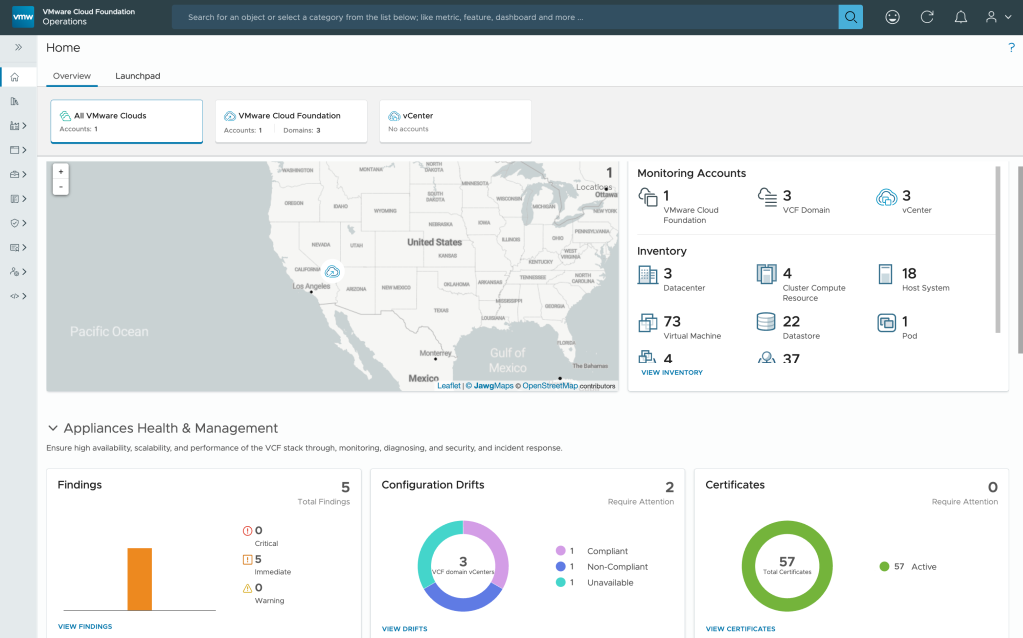
- Use the Geo-map view to identify where the VCF instances are deployed across the globe.
- See the Inventory section view showing VCF domains, datacenters, clusters, ESX host, VMs deployed in the environment.
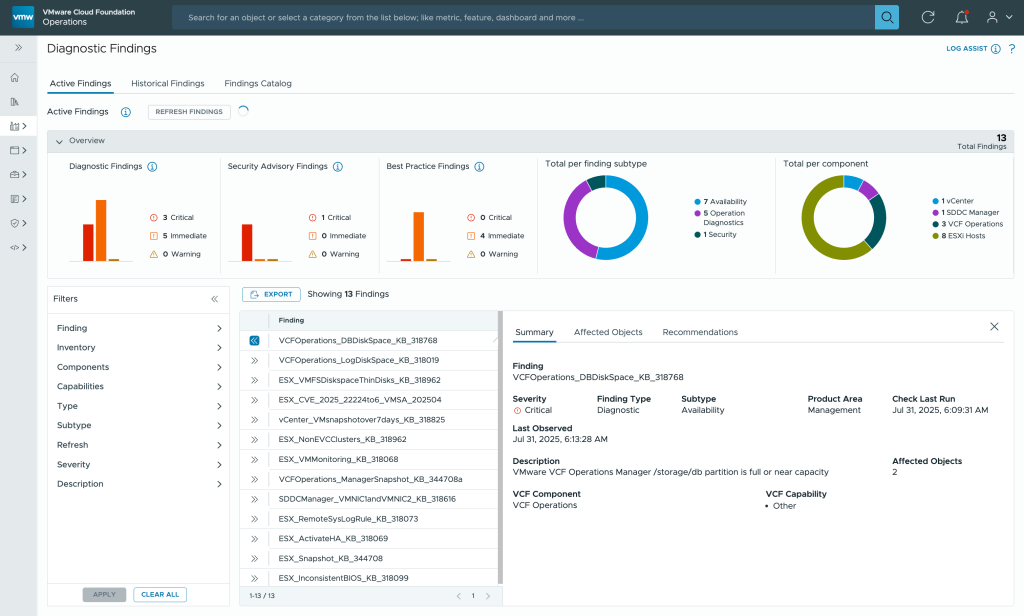
- Diagnostic Findings correlates issues across your infrastructure by scanning and evaluating available signatures and highlighting current issues on the Active Findings page; also, view security risks based on advisories (CVE and VMSAs).
- Configuration drifts detect any misconfigurations in vCenter deployments and Host clusters activated with vSphere configuration profiles.
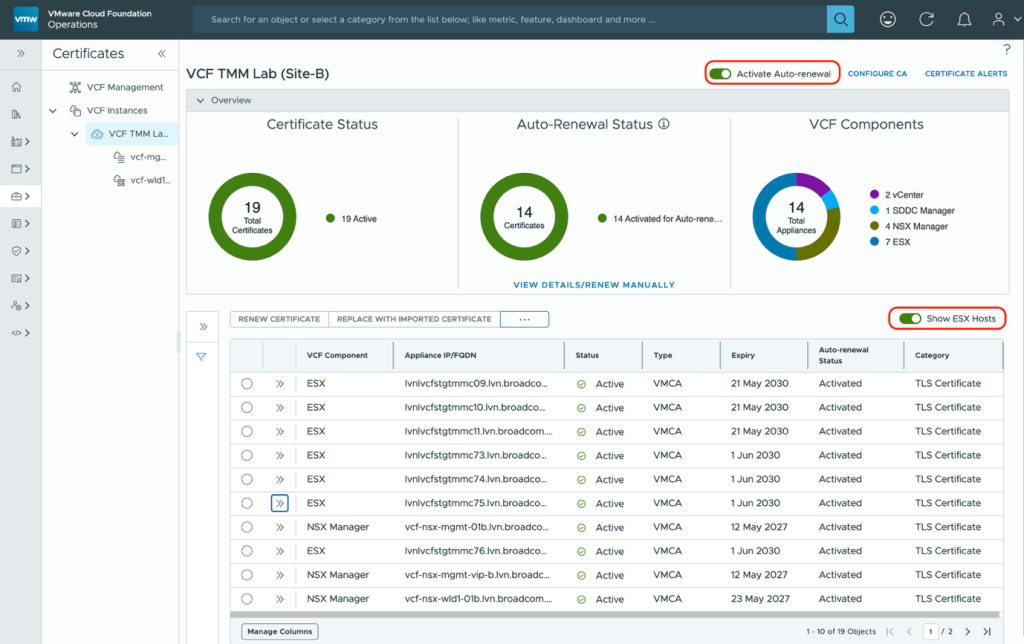
- Certificates status – View and manage certificates for all VCF core and management components with auto-renewal capabilities for ESX host and other VCF components. No more service outages due to certificate issues.
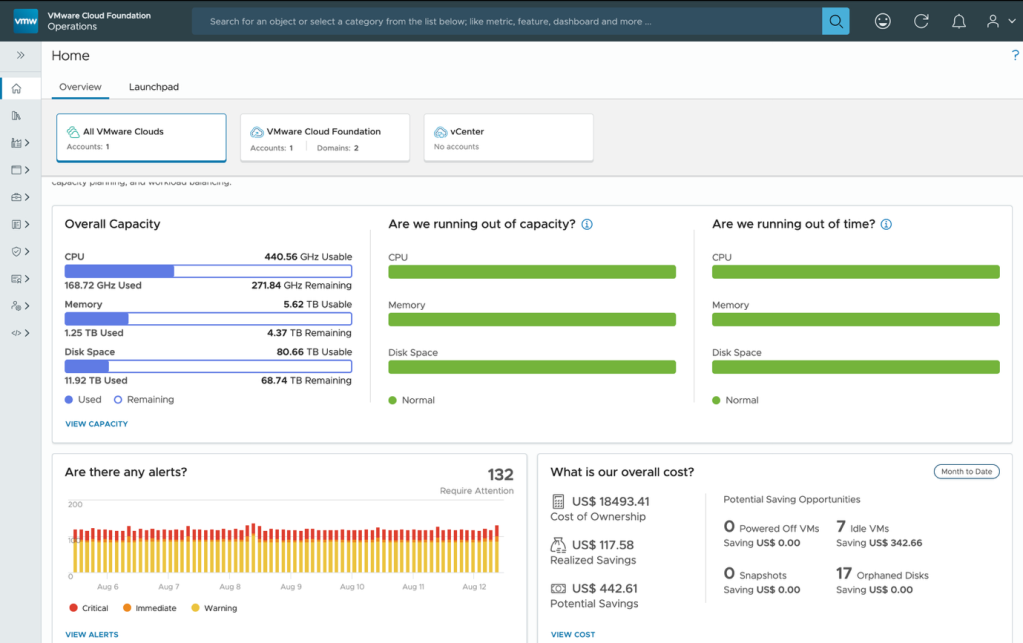
- You can also view overall capacity usage and shortfalls, actionable alerts and overall cost of ownership of running business and optimisation opportunities to reclaim or right-size workloads in the VMware Cloud Infrastructure.
Infrastructure Teams: How do I ensure my VCF environment is healthy before I start deploying application workloads?
The VCF Health page allows you to see the operational health state of the VCF instances; here you see VCF instances and domains where immediate attention is required to ensure your environment is running smoothly.
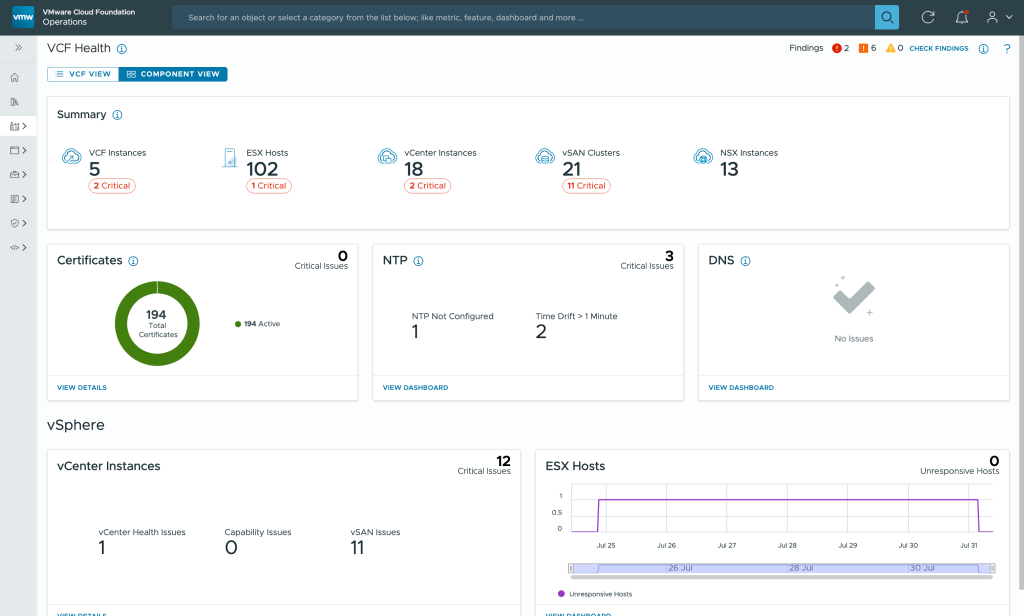
It can report issues like unresponsive ESX hosts, NTP drift sync issues within host and vCenter and DNS resolution failures due to forward lookup or reverse lookup failures within ESX and vCenter deployments.
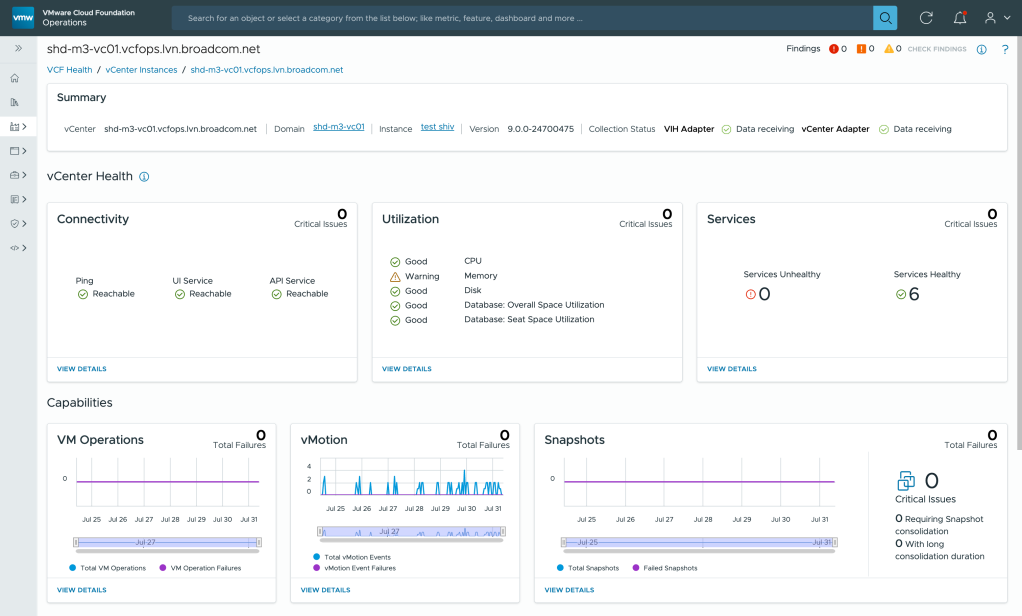
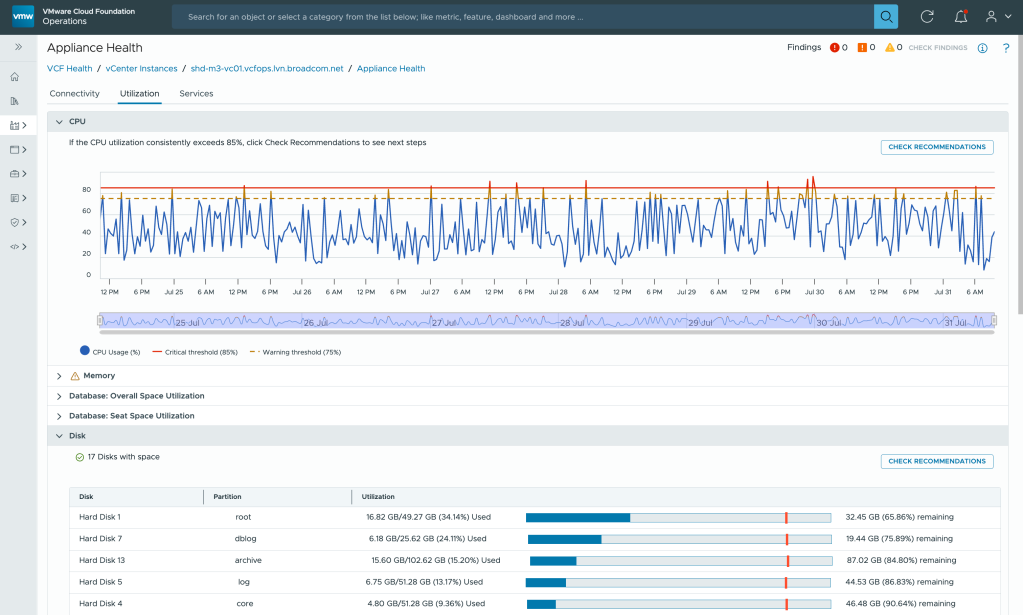
The VCF Health page also reports the vCenter connectivity state, resource utilization and status of critical vCenter services.
The dashboard also provides insights into other capabilities like the VM operation failures (Ex: OVF deployment failures, VM power operations, delete operations), vMotion failures, and Snapshot failures (Ex: failed snapshots, long running snapshots).
VCF’s Diagnostic Findings helps correlate issues across your infrastructure by scanning and evaluating security signatures and highlighting open issues on the Active Findings page. VI Admins can take actions on security risks based on advisories (CVE and VMSAs).
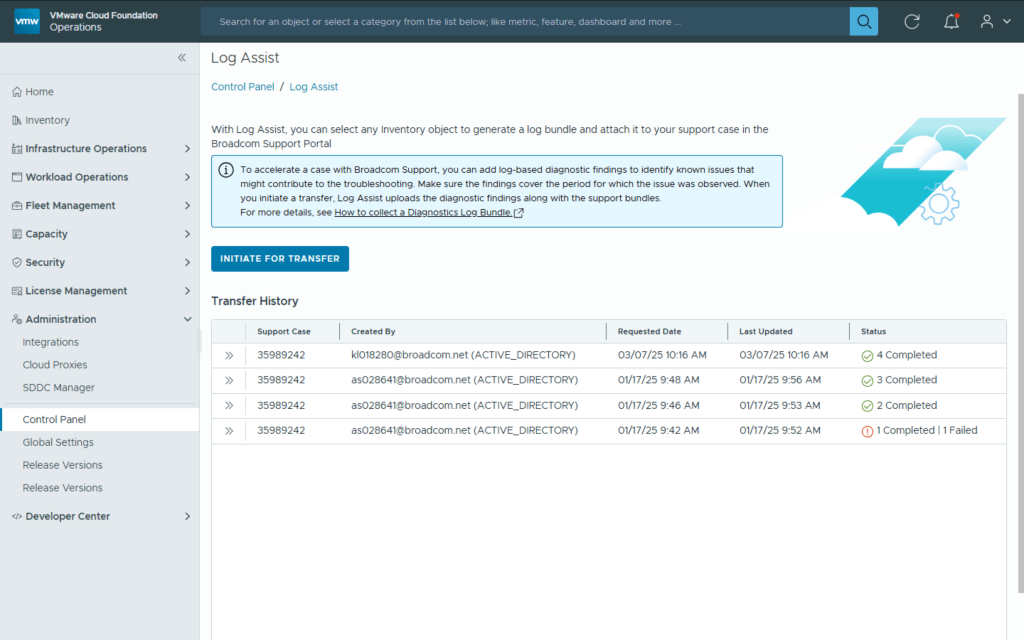
The New LogAssist integration speeds up the resolution of an open support request by sending log bundles to the Broadcom Support Team. It’s a direct transfer that is fast and secure. No FTP sites are needed!
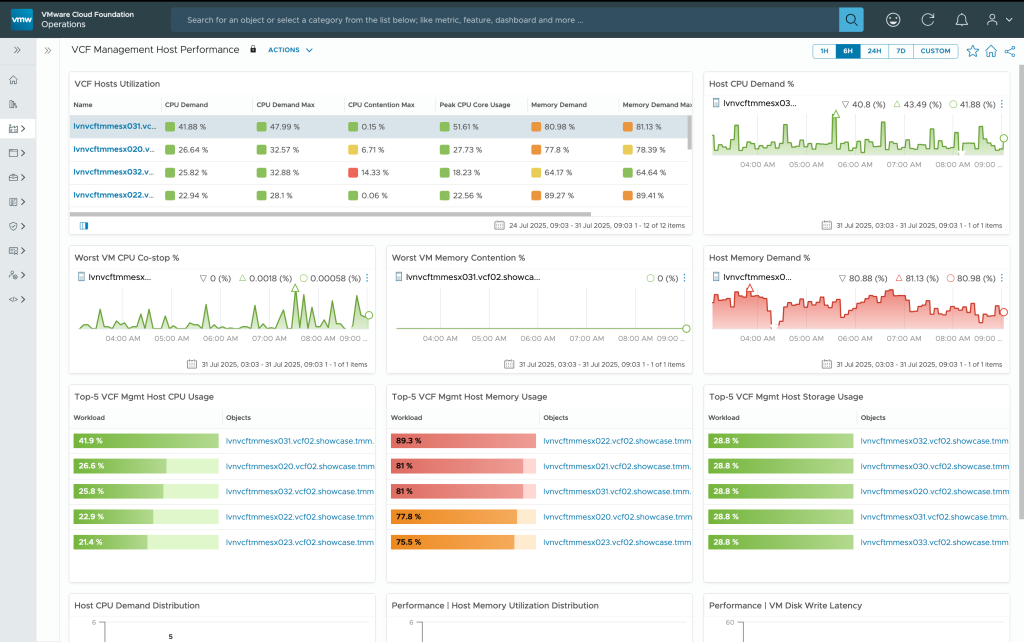
You also get out-of-the-box performance dashboards that are designed for infrastructure teams to monitor VCF infrastructure performance health and its components. Use these performance dashboards to detect any performance problems related to core components within management and workload domains. Take these proactive steps before you start deploying application workloads.
Infrastructure Teams: I am not a storage or a network expert. How am I going to manage and troubleshoot problems in those areas?
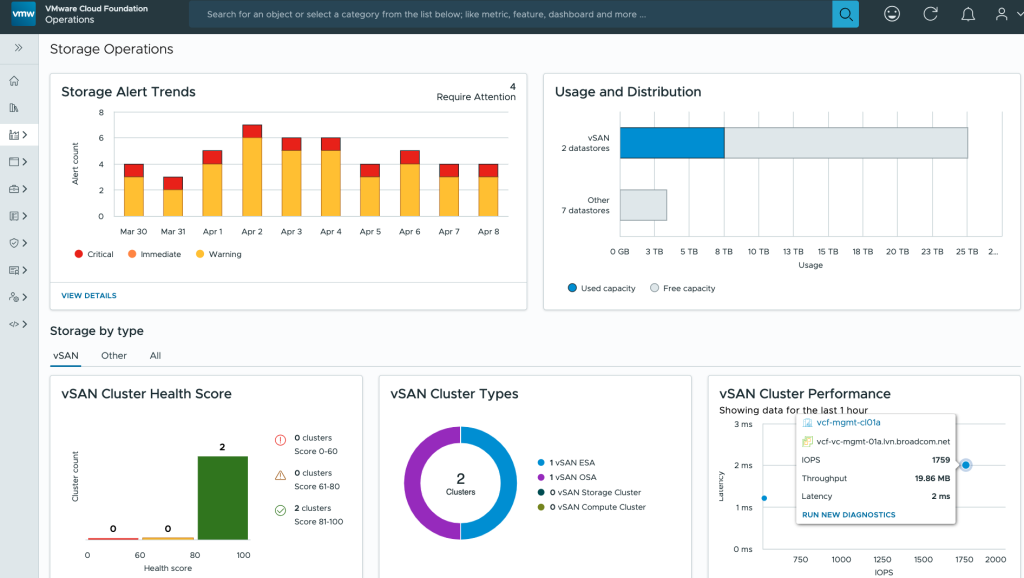
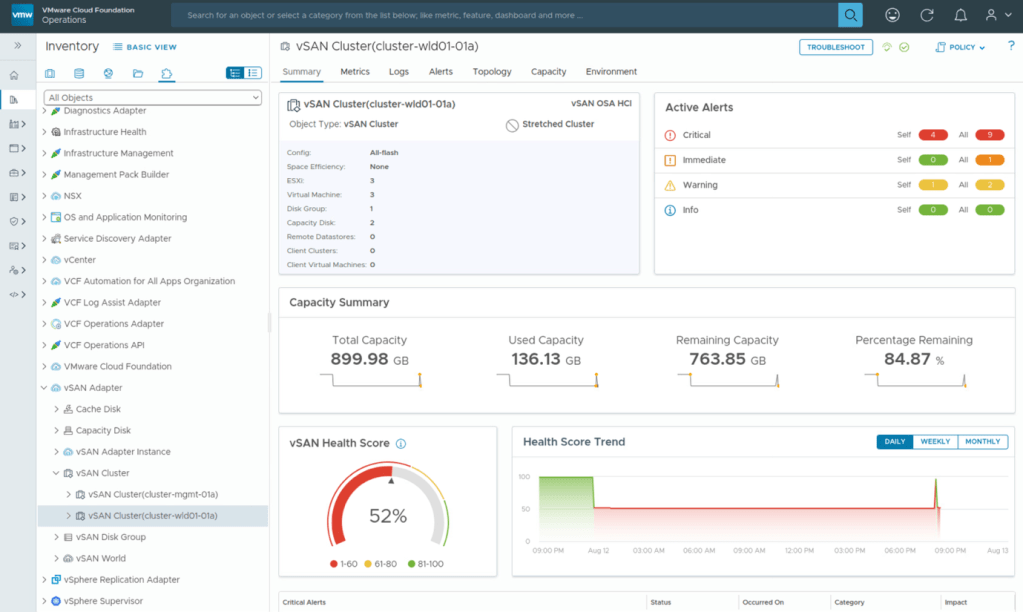
VCF 9.0 provides a new Storage Operations home page with all information in one place including:
- Visibility into active storage specific alerts (all the critical and warning alerts)
- Capacity usage of vSAN clusters and other datastores deployed in the VCF stack
- Cluster health scores and different cluster types deployed within your VCF infrastructure along with performance KPIs such as:
- IOPS
- Throughput
- Latency
- Inventory of all the storage clusters including vSAN and third-party clusters
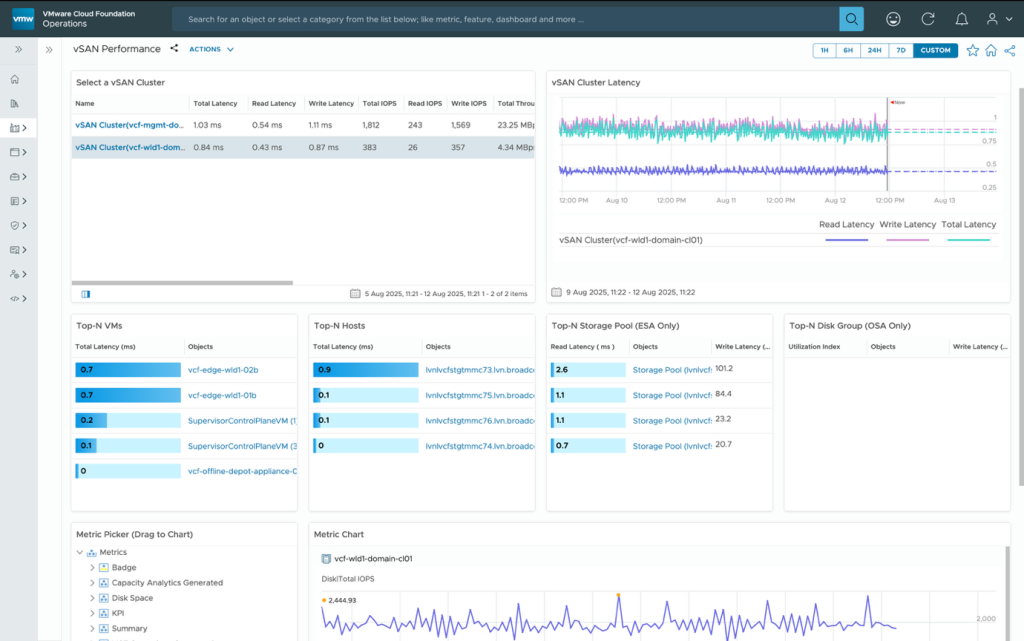
A new vSAN Performance Dashboard provides insights into key performance metrics and latency for the clusters, Top N analysis including VM, host and disk groups. The metric picker helps deep dive into available vSAN metrics for detailed analysis and monitoring.
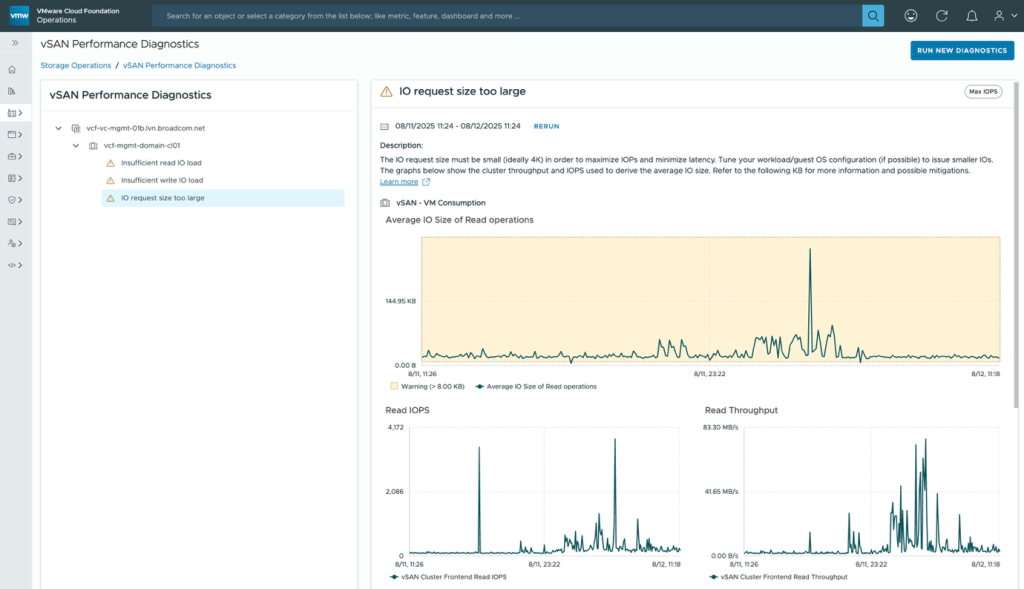
A Diagnostics page enables you to test new clusters entering production, or existing clusters already in production, to check their health and improve performance readiness.
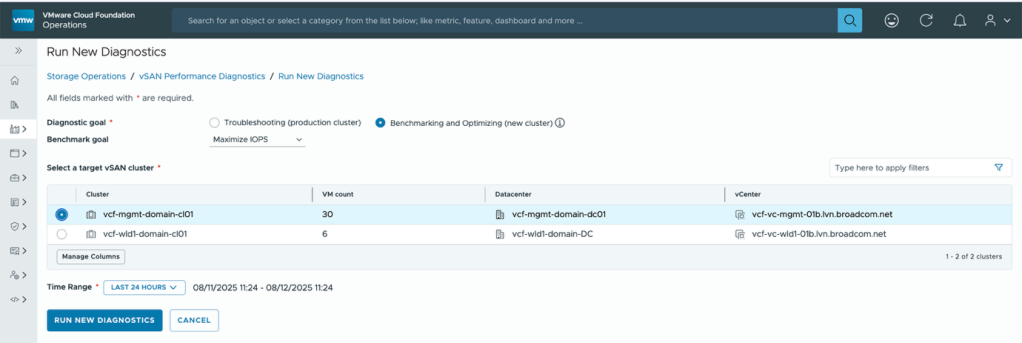
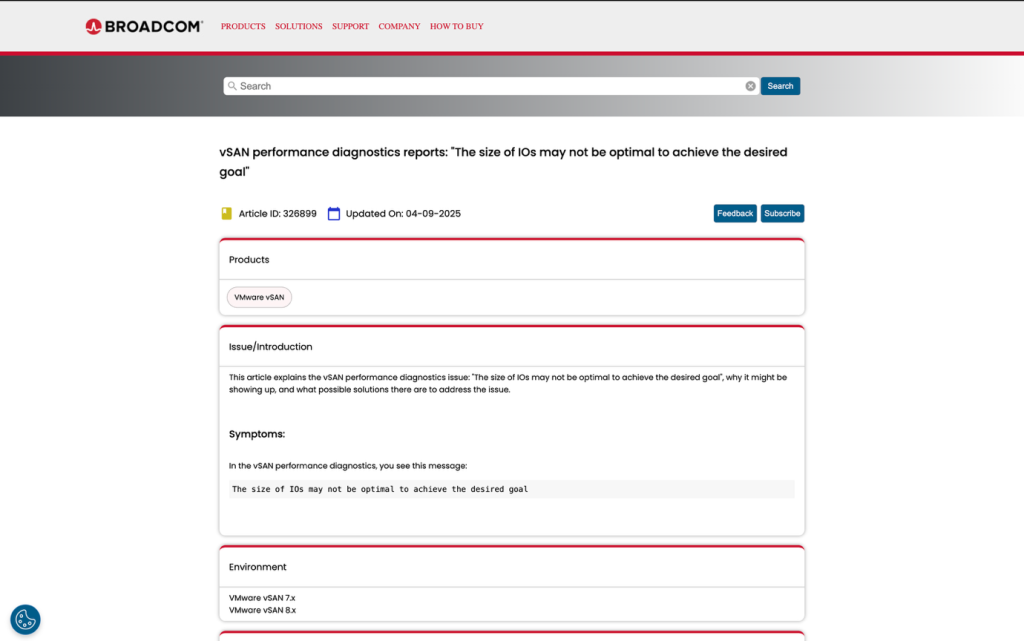
The Diagnostics page helps detect issues, suggests remediation steps through Knowledge Base articles, and provides supporting performance graphs for further insight.
A new Network Operations Home page provides a complete network view with real-time NSX health monitoring, traffic analysis, and application insights, VPC deployments, health and traffic statistics.
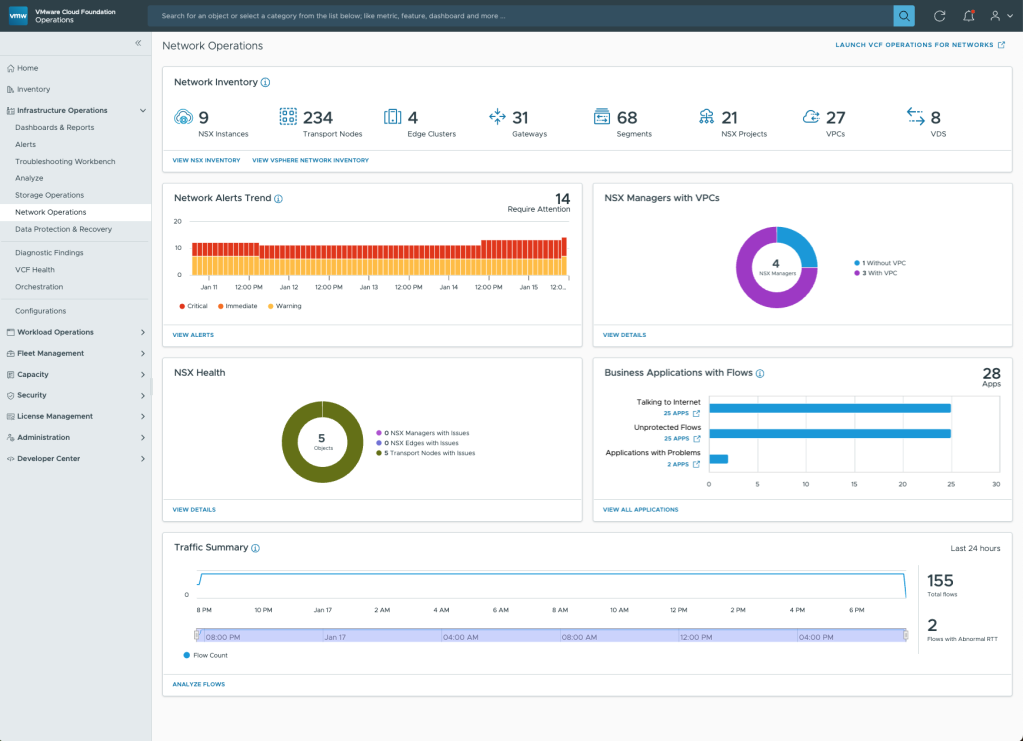
You gain quick access to a traffic summary and flow analysis, making it easier to detect and troubleshoot issues. Additionally, application insights allow you to understand how network health impacts workloads.
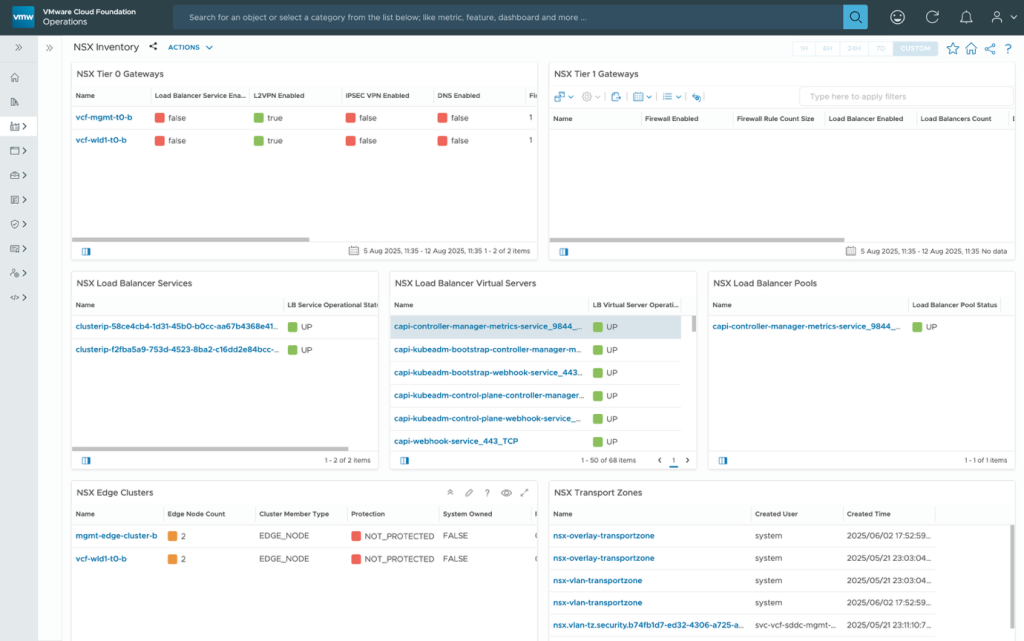
The NSX Inventory dashboard provides a holistic view of NSX environment topology. It offers a graphical representation of the interconnections between various NSX components.
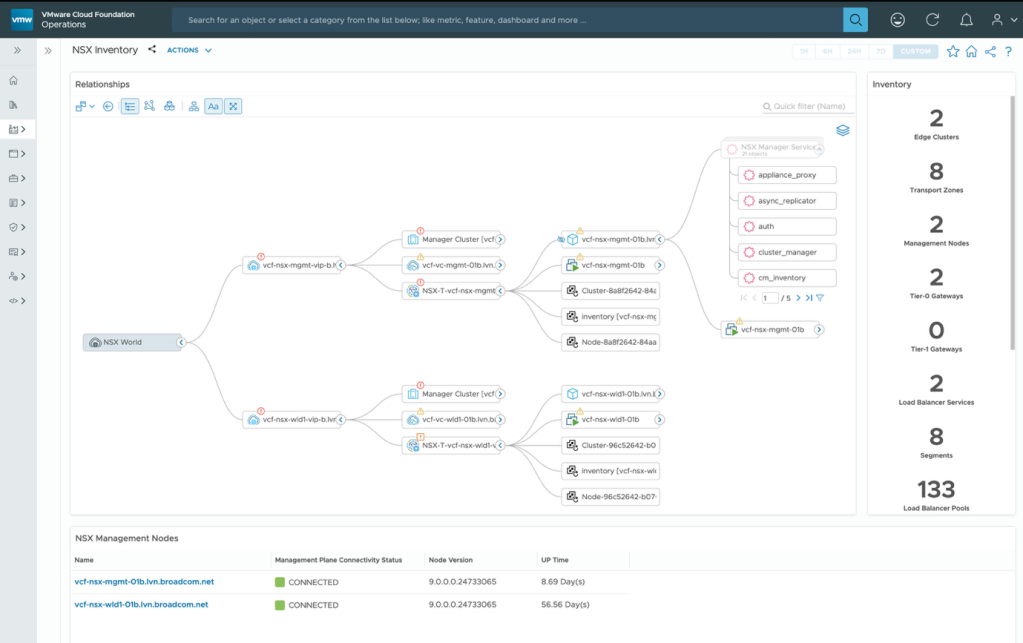
The NSX inventory dashboard shows different services that are deployed like the NSX Transport zones, Edge clusters, Gateways, Load Balancer services and reports their health.
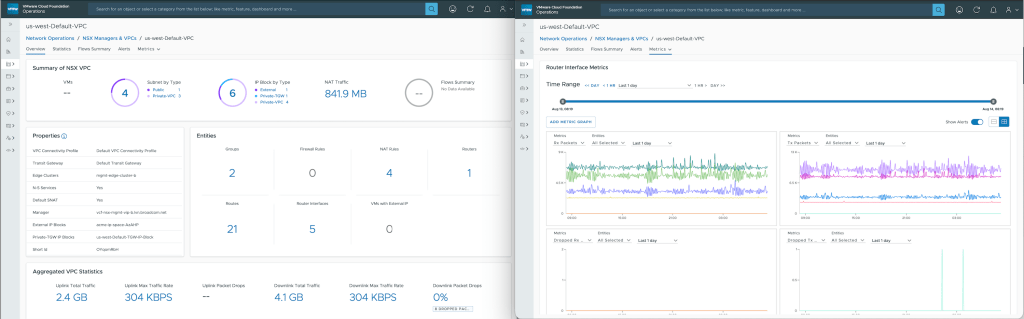
The NSX VPC page shows all the VPC’s configured for the projects with detailed properties, configuration and metric KPIs.
SRE Team: I need better Observability to quickly see and correlate infrastructure and application problems and compare performance across timelines.
VCF 9.0 provides a new integrated user experience for analysis based on logs, metrics, and flows. You can view and analyze logs from the VCF Operations console. You can parse, modify, process, and analyze logs collected from various VCF components with an advanced list of predefined search fields that are available statically, from content packs, and in custom content.
Here is one scenario where we could quickly detect host power failures through logs that impacted overall vSAN health.
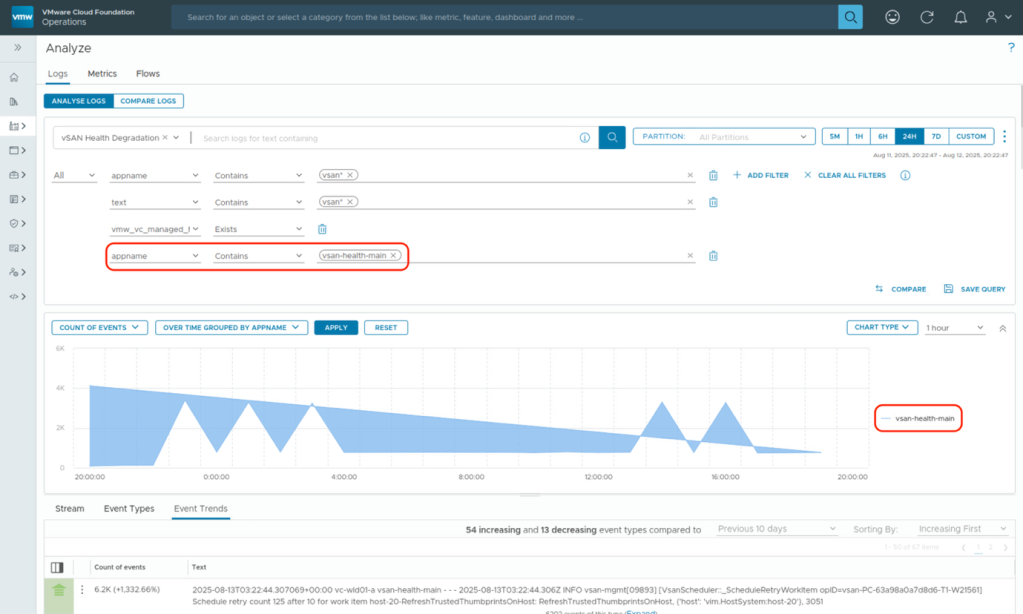
There are also improvements like using standardized log format. This improves log consistency across the VCF components, simplifies troubleshooting, and facilitates automation-driven log consumption.
The metric-based search engine allows users to quickly search for object metrics and properties associated with object types.
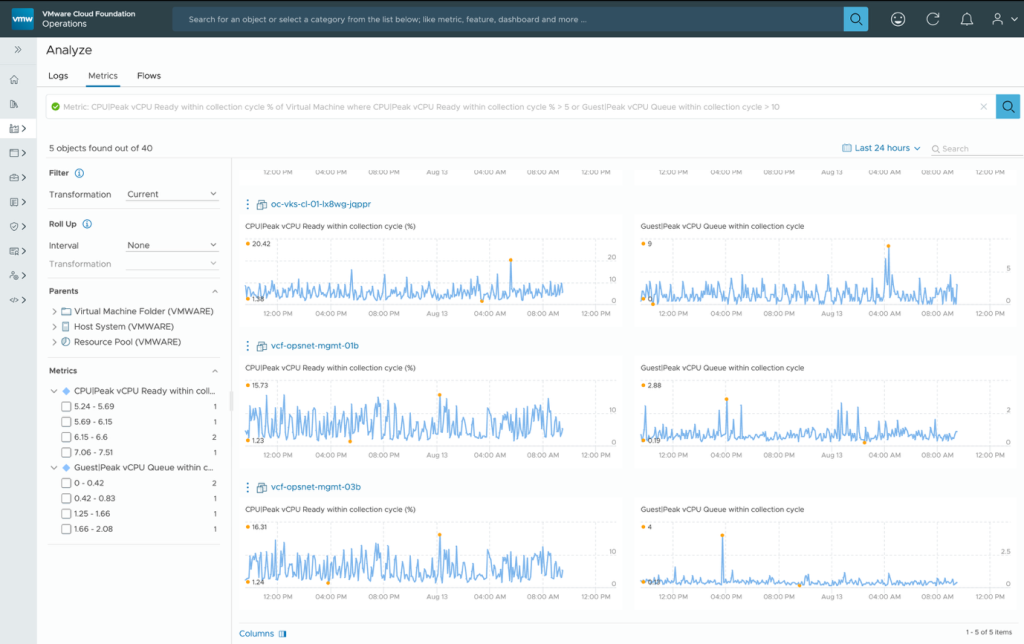
You can add conditions using multiple metrics and VCF Operations provides auto completion of options during your search.
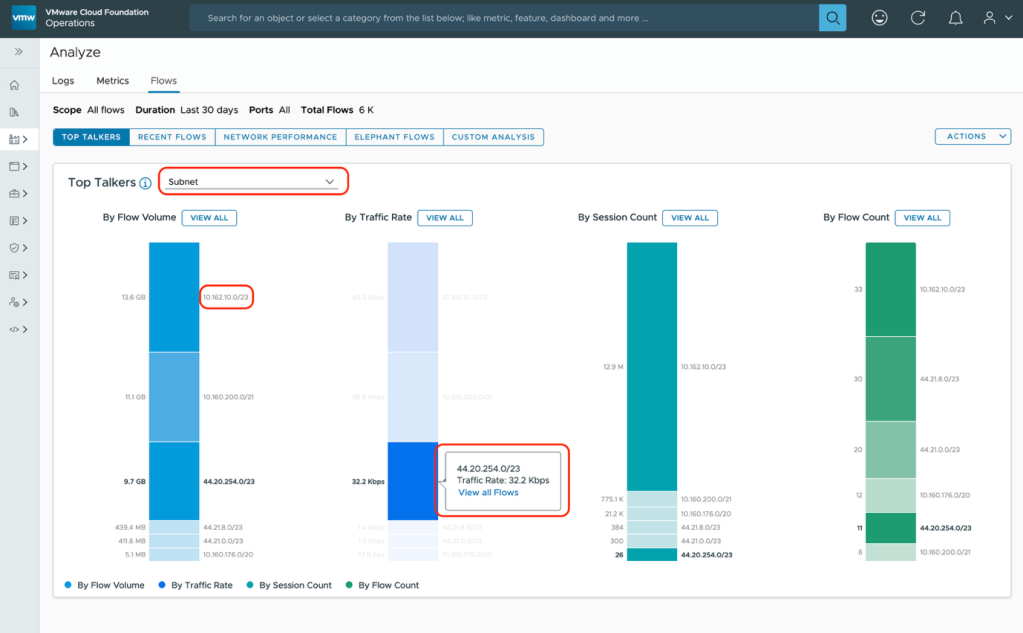
The Network Flow Insight page provides an insight into data centers, devices, and flows. It is a context-based page as it performs analysis based on the entities, flows, and the time range that you select.
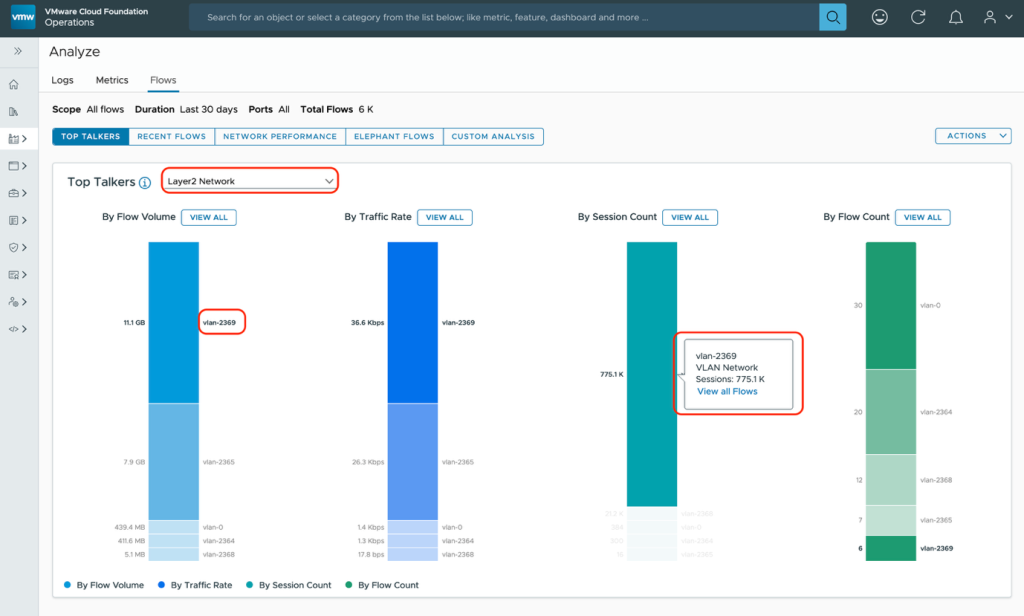
Here you can analyze all the flows available in your environment by flow volume, traffic rate, session count, and flow count. You can identify top talking entities in your environment and find abnormal flows for various range of TCP round trip times (RTT).
SRE Team: Kubernetes scares me. How can I manage and troubleshoot issues?
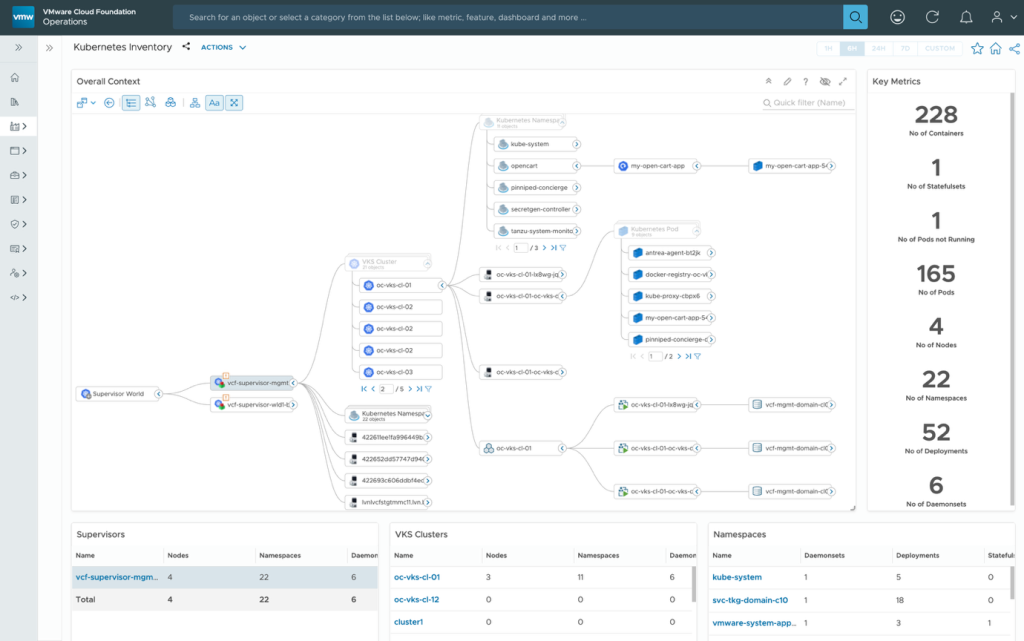
With VCF 9.0, you get out-of-the-box vSphere Kubernetes integration, which auto-discover the whole Kubernetes constructs of the control pane. The Kubernetes inventory dashboard shows the overall topology, displaying the Kubernetes constructs like the namespaces, deployments, the nodes, pods, and containers.
You also get an out-of-the-box vSphere Kubernetes Health dashboards showing key metrics like the CPU throttling, ETCD and API server performance requests.
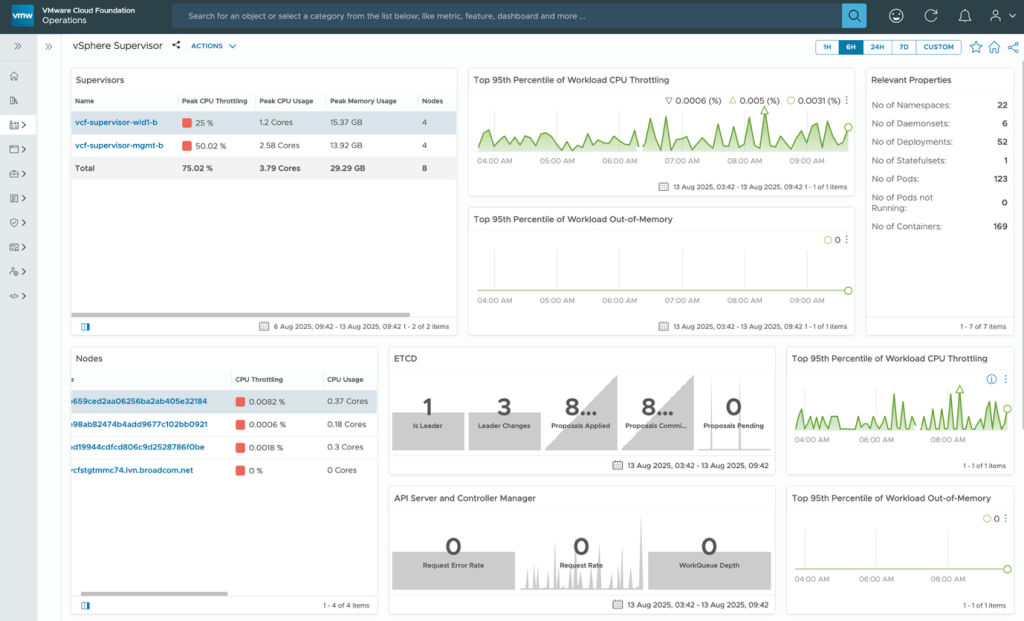
These are new control pane metrics included in these dashboards as control pane forms a very important component for Kubernetes clusters. These dashboards provide pointers in that direction for troubleshooting issues.
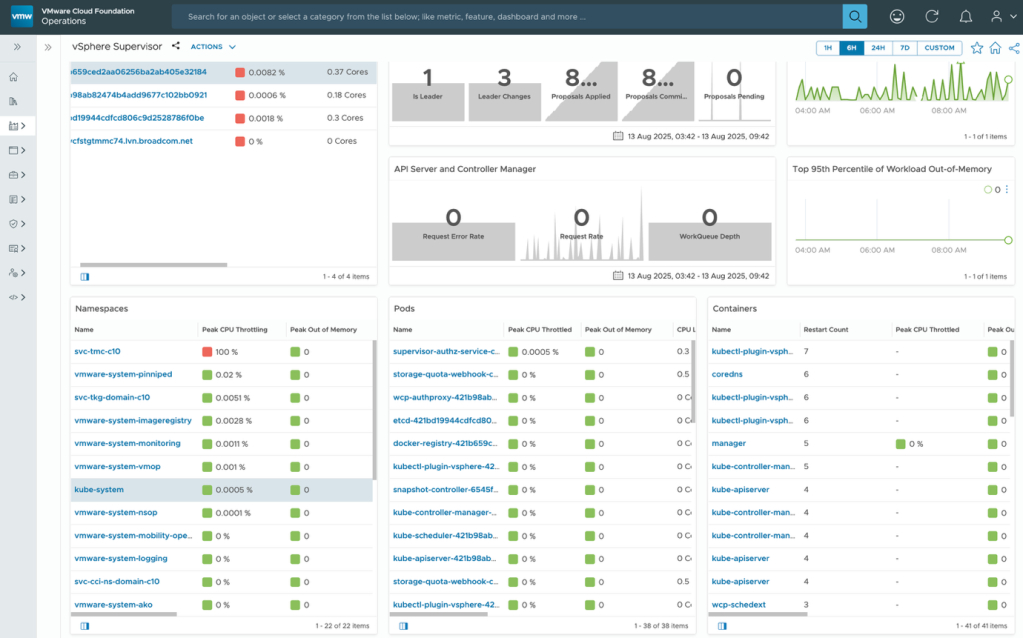
Also, different KPIs for the Kubernetes clusters like the CPU, memory, disk, the nodes, pods and the container-level metrics to help troubleshoot performance issues.
Application teams: But isn’t it all about the applications? How can I manage those too?
The Critical Business Applications dashboard helps monitor health and availability of business-critical and Tier-1 applications.
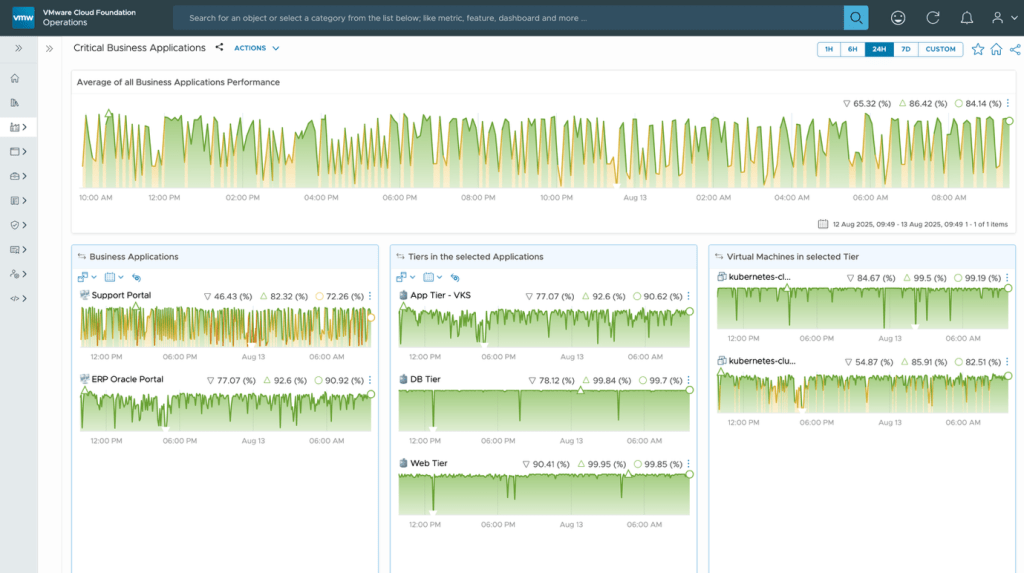
From the Business Applications widget, drill down to the Tiers within the application, and from the Tiers widget, you can drill down to the virtual machines or Kubernetes entities.
You can drill down even further to see the overall Business Application Topology, showing the logical view and infrastructure-dependent views.
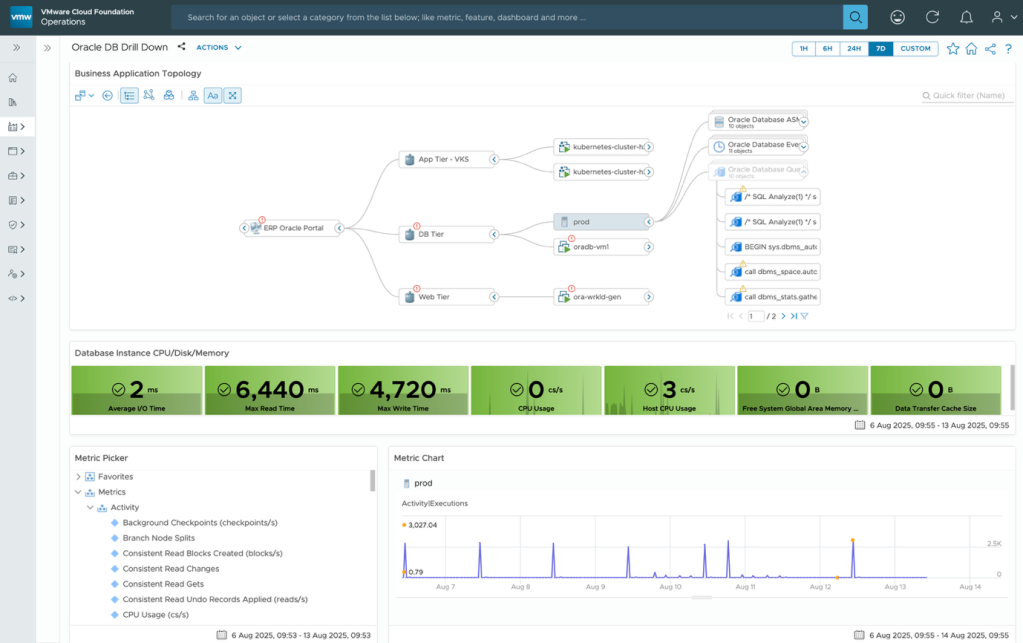
The dashboard is useful for DBAs to monitor the health of the Oracle database instances. The dashboard shows active Oracle database instances, object relationships, CPU/disk/memory for database instances and database instance performance.
VCF 9.0 also introduced the new “Logs Compare” feature. Here is one scenario where we want to track all the client connection requests, network usage statistics, and service registration events over the week. We run a query to view all the Oracle database listener events over a period of time.
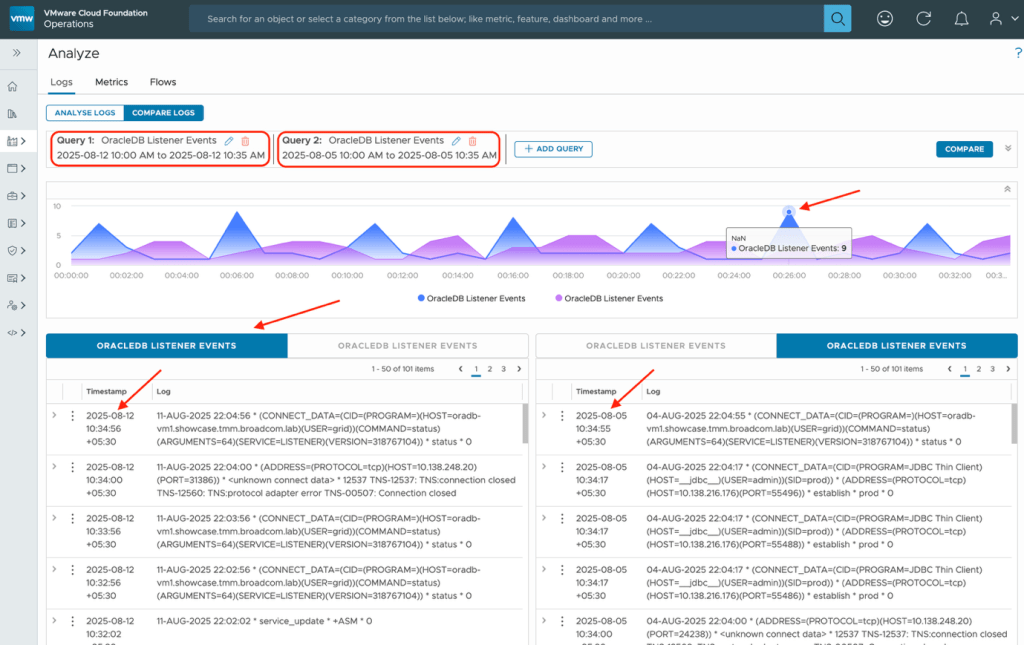
Here, you see the historical trend of all client requests and connections on a weekly basis using the “Logs Compare” feature. The log comparison is displayed as a stacked line chart, and the log results appear side by side in query tabs under the chart. This is another handy feature for troubleshooting performance issues related to applications or detecting infrastructure changes.
This post should give you a good understanding of how the new VCF 9 features can improve the overall troubleshooting experience and improve operational effectiveness of the NOC teams, SREs, IT administrations, and application teams.
Discover more from VMware Cloud Foundation (VCF) Blog
Subscribe to get the latest posts sent to your email.


