
In Part 1 of this series, we established the backend FinOps architecture within VMware Cloud Foundation (VCF). By combining Custom Groups, custom metadata (Monthly_Budget), Chargeback metering metrics, and policy-scoped Super Metrics, we built an automated alert engine that fires warning notifications the moment a tenant organization breaches 80% of its monthly budget allocation.
However, automated email alerts and event logs are only half the battle. For C-level technology leaders and FinOps steering committees managing dozens of multi-tenant accounts, reacting to individual alert streams is inefficient. True operational excellence requires a centralized, executive-level visualization layer—a single pane of glass that renders tenant spend velocity, visual health colorization, and active guardrail alerts.
This guide walks through the step-by-step creation of the FinOps – Tenant Budget & Spend Governance Dashboard in VCF Operations, specifically updated to address the latest UI layout changes and metric scoping rules.
Step 1: Create the Blank Dashboard Canvas
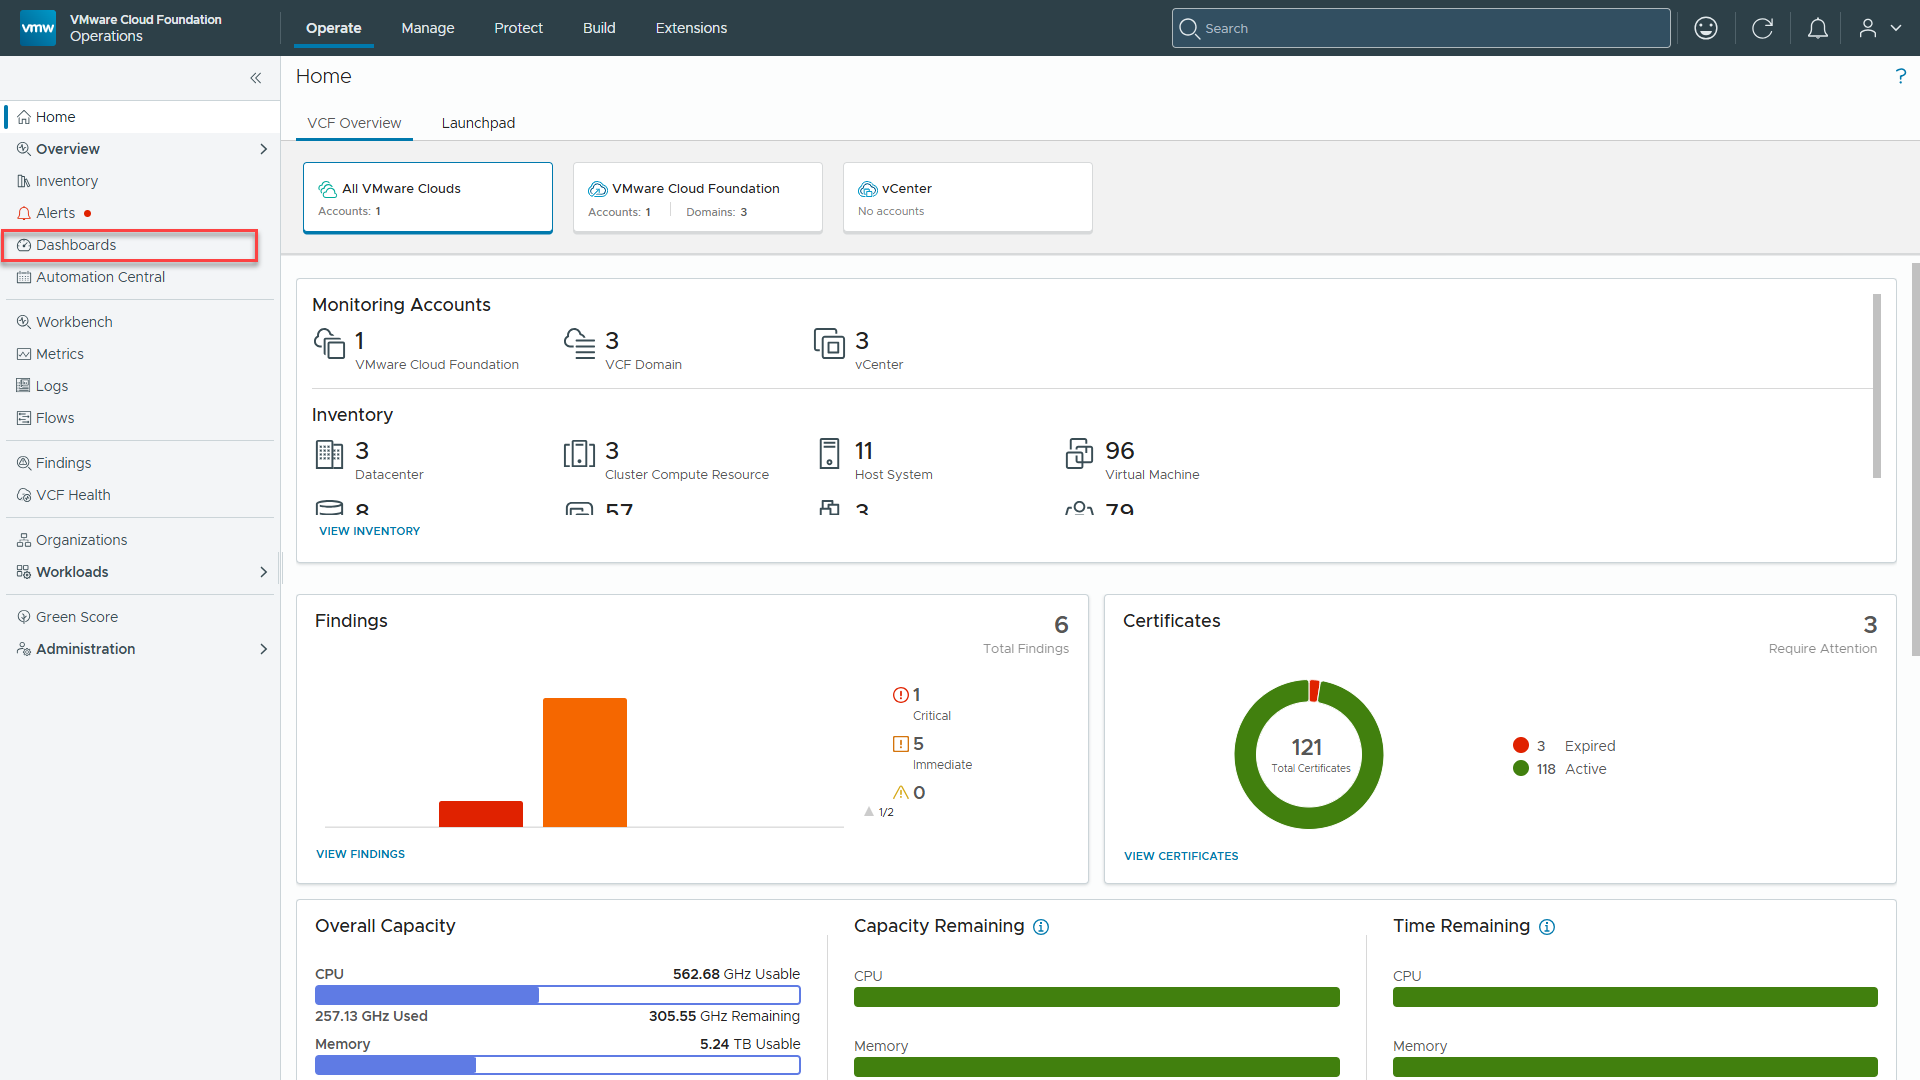
- In VCF Operations 9.1.1, navigate to Operate Dashboards.
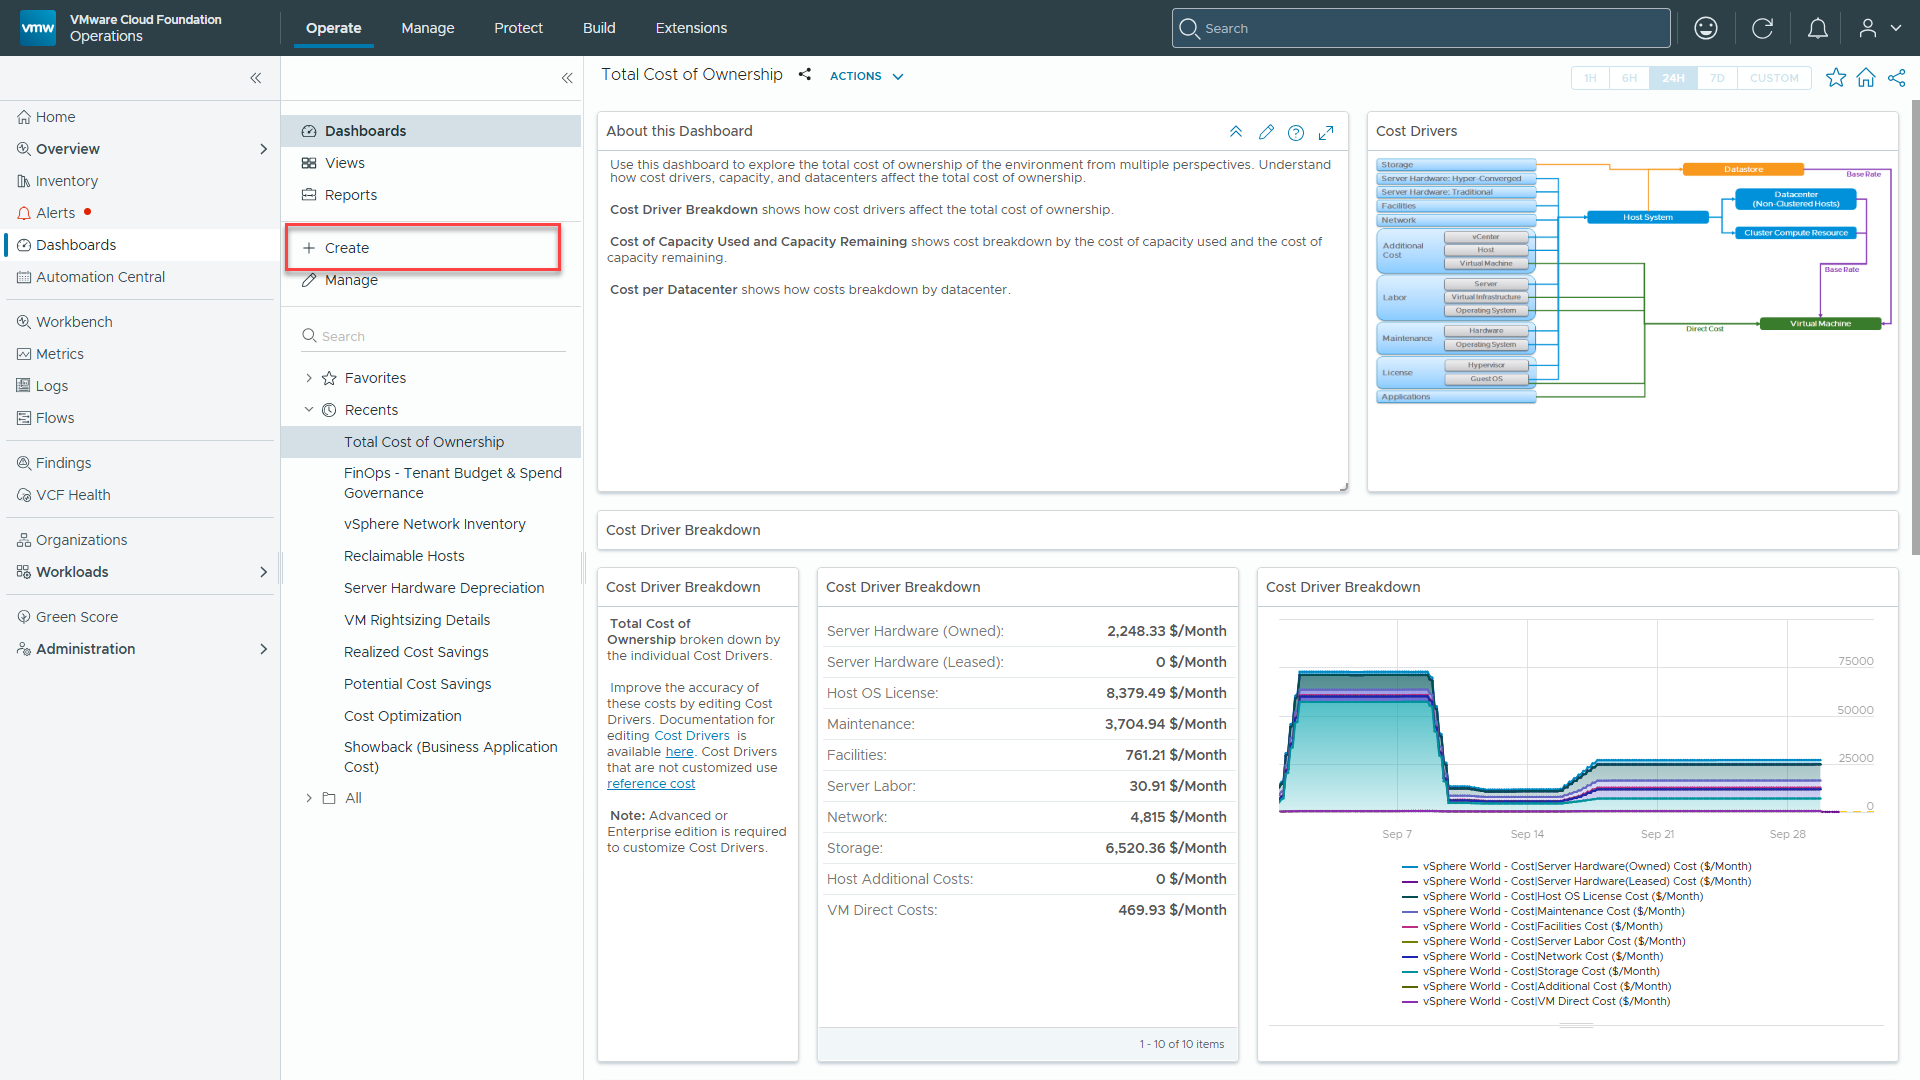
2. Click + Create in the left navigation panel under Dashboards.
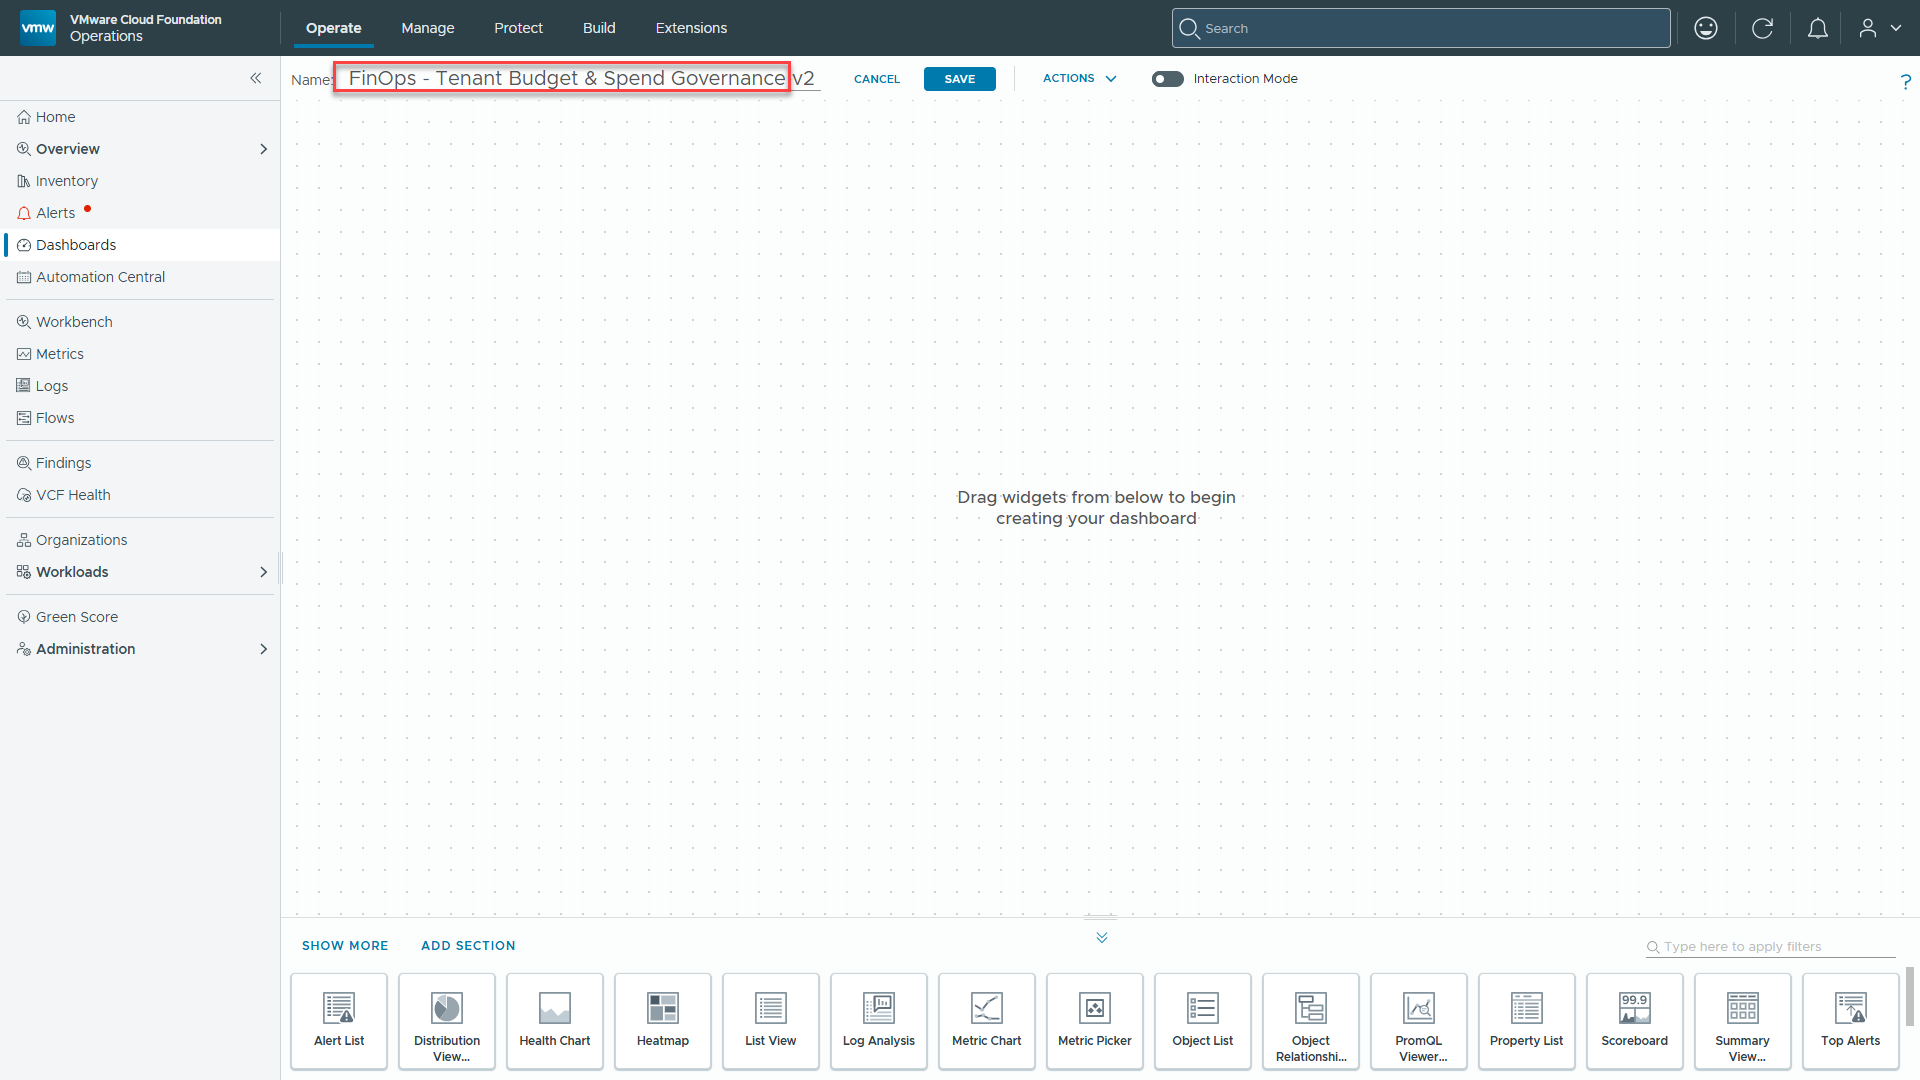
3. Set the Dashboard Name to: FinOps – Tenant Budget & Spend Governance.
Step 2: Add and Configure Widget 1 – Tenant Budget Health Heatmap
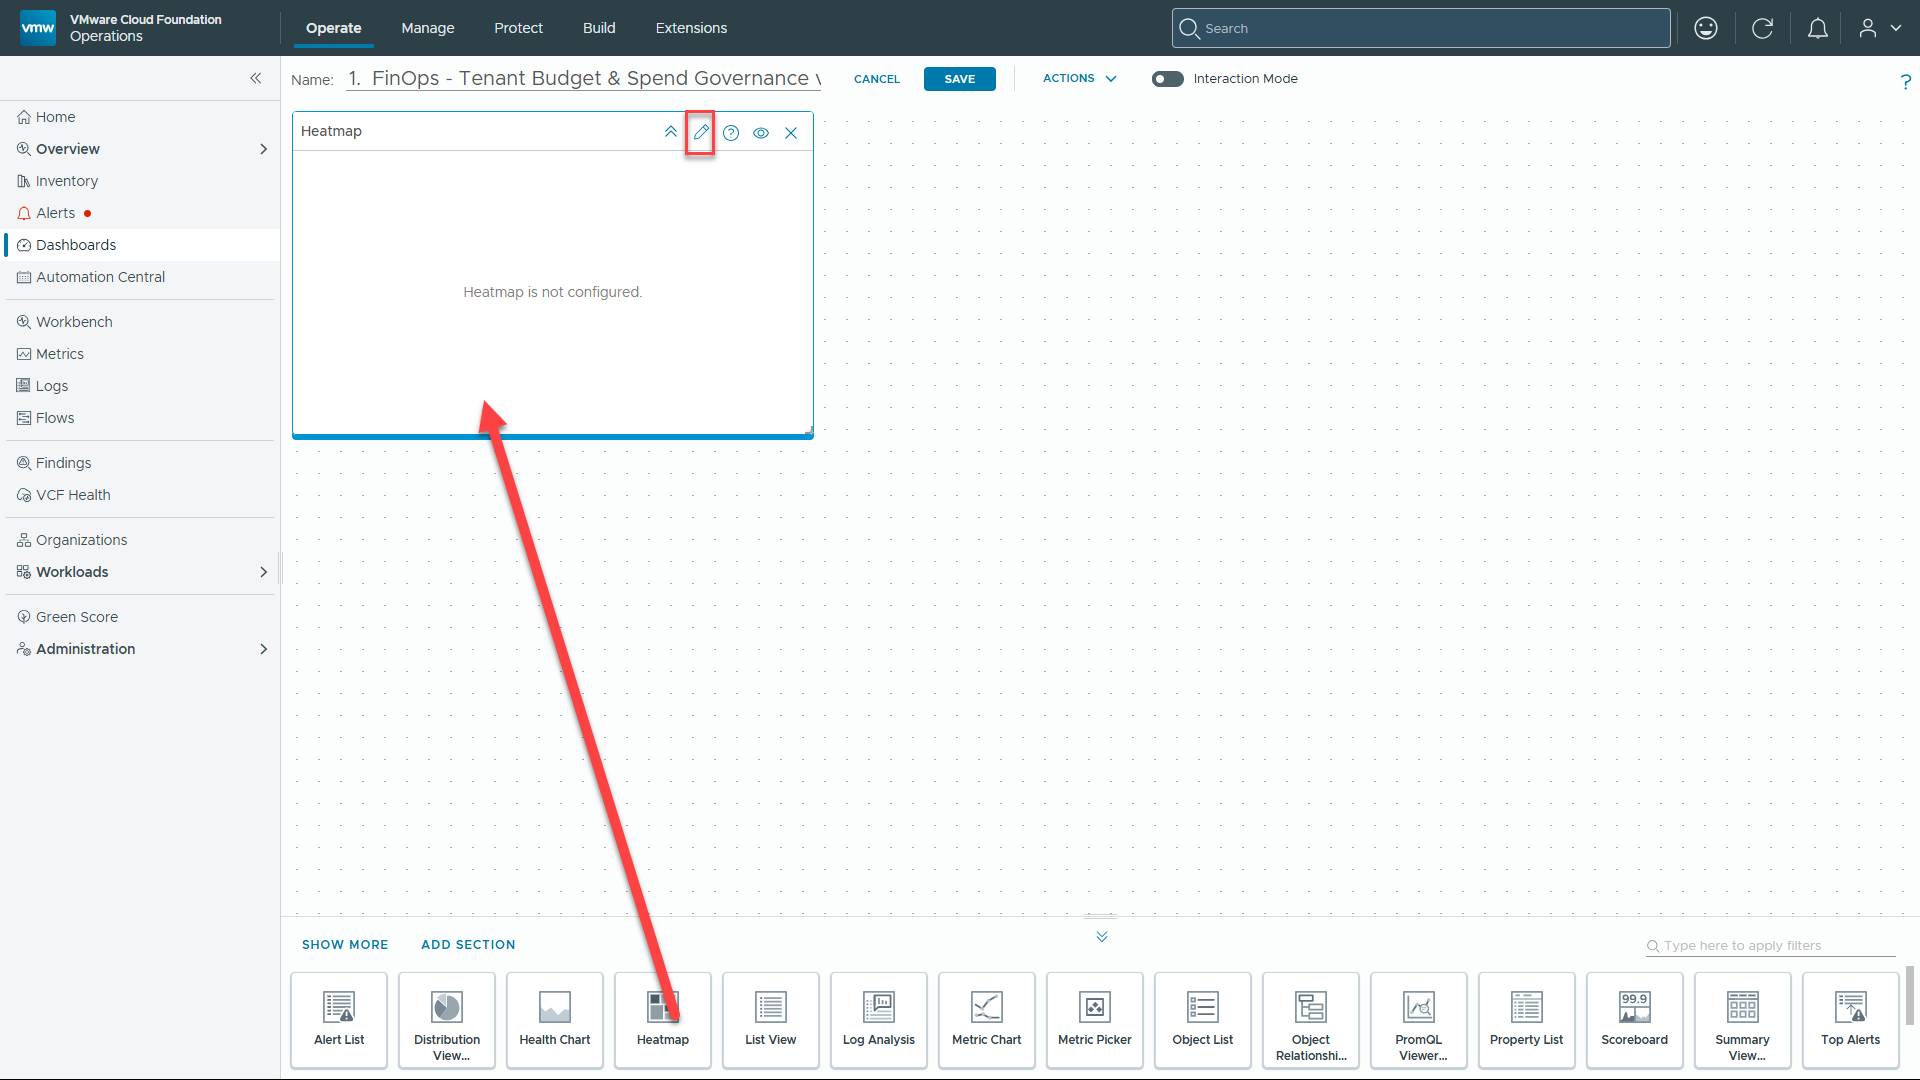
- In the bottom Widgets toolbar, locate Heatmap and drag it onto the main canvas.
- Hover over the top-right corner of the new Heatmap widget box and click the Pencil icon (Edit Widget).
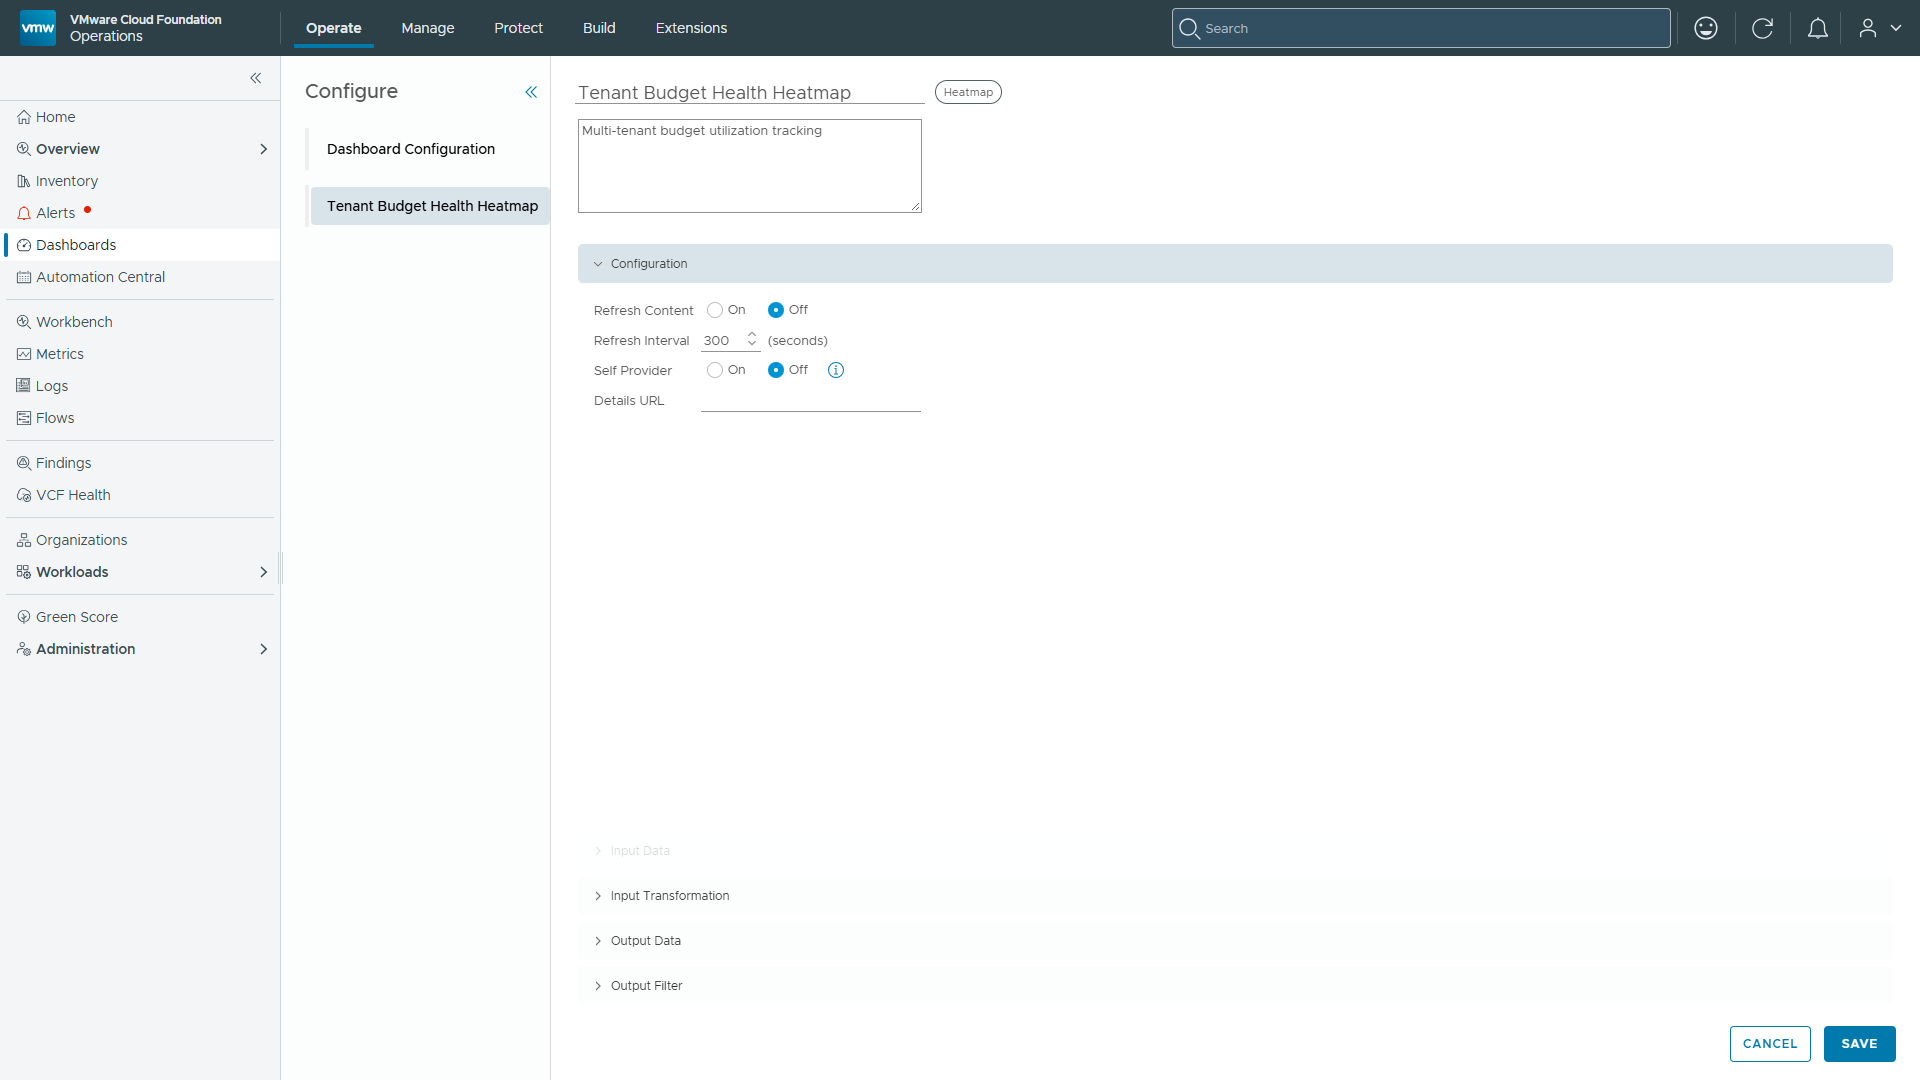
Section A: Title & Header Settings
- Title: Enter Tenant Budget Health Heatmap.
- Description: Multi-tenant budget utilization tracking.
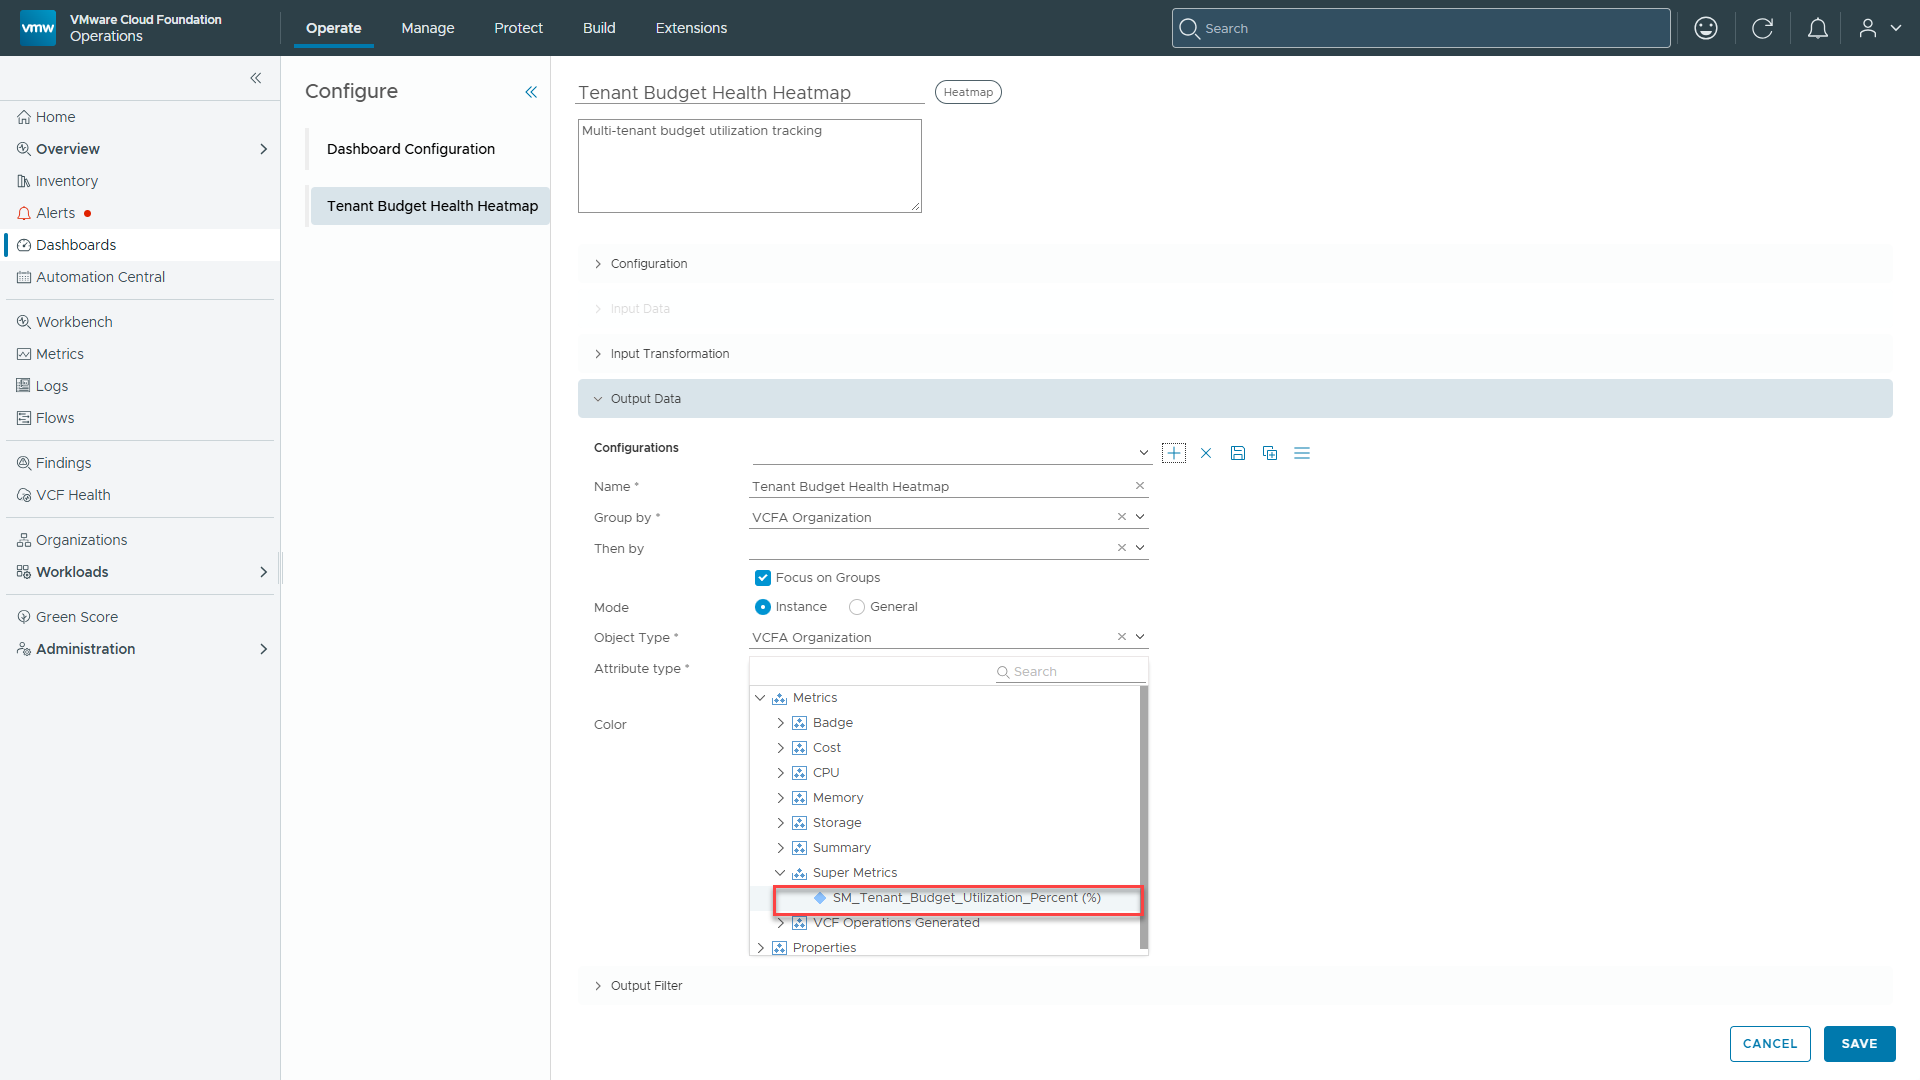
Section B: Output Data Accordion Configuration
Expand the Output Data accordion section and set the following parameters:
- Configurations: Leave default (Tenant Budget Health Heatmap).
- Name *: Tenant Budget Health Heatmap
- Group by *: Click the dropdown, expand VCF Automation for All Apps Organization, and select VCFA Organization.
- Focus on Groups: Check the box.
- Mode: Select the Instance radio button.
Operational Note: Selecting Instance unlocks the specific VCFA Organization object tree. Leaving this on General will prevent the custom budget Super Metrics from appearing in the metric picker.
6. Object Type *: Select VCFA Organization.
7. Attribute type *: Click the dropdown, search for “SM_”, expand Super Metrics, and select: SM_Tenant_Budget_Utilization_Percent (%).
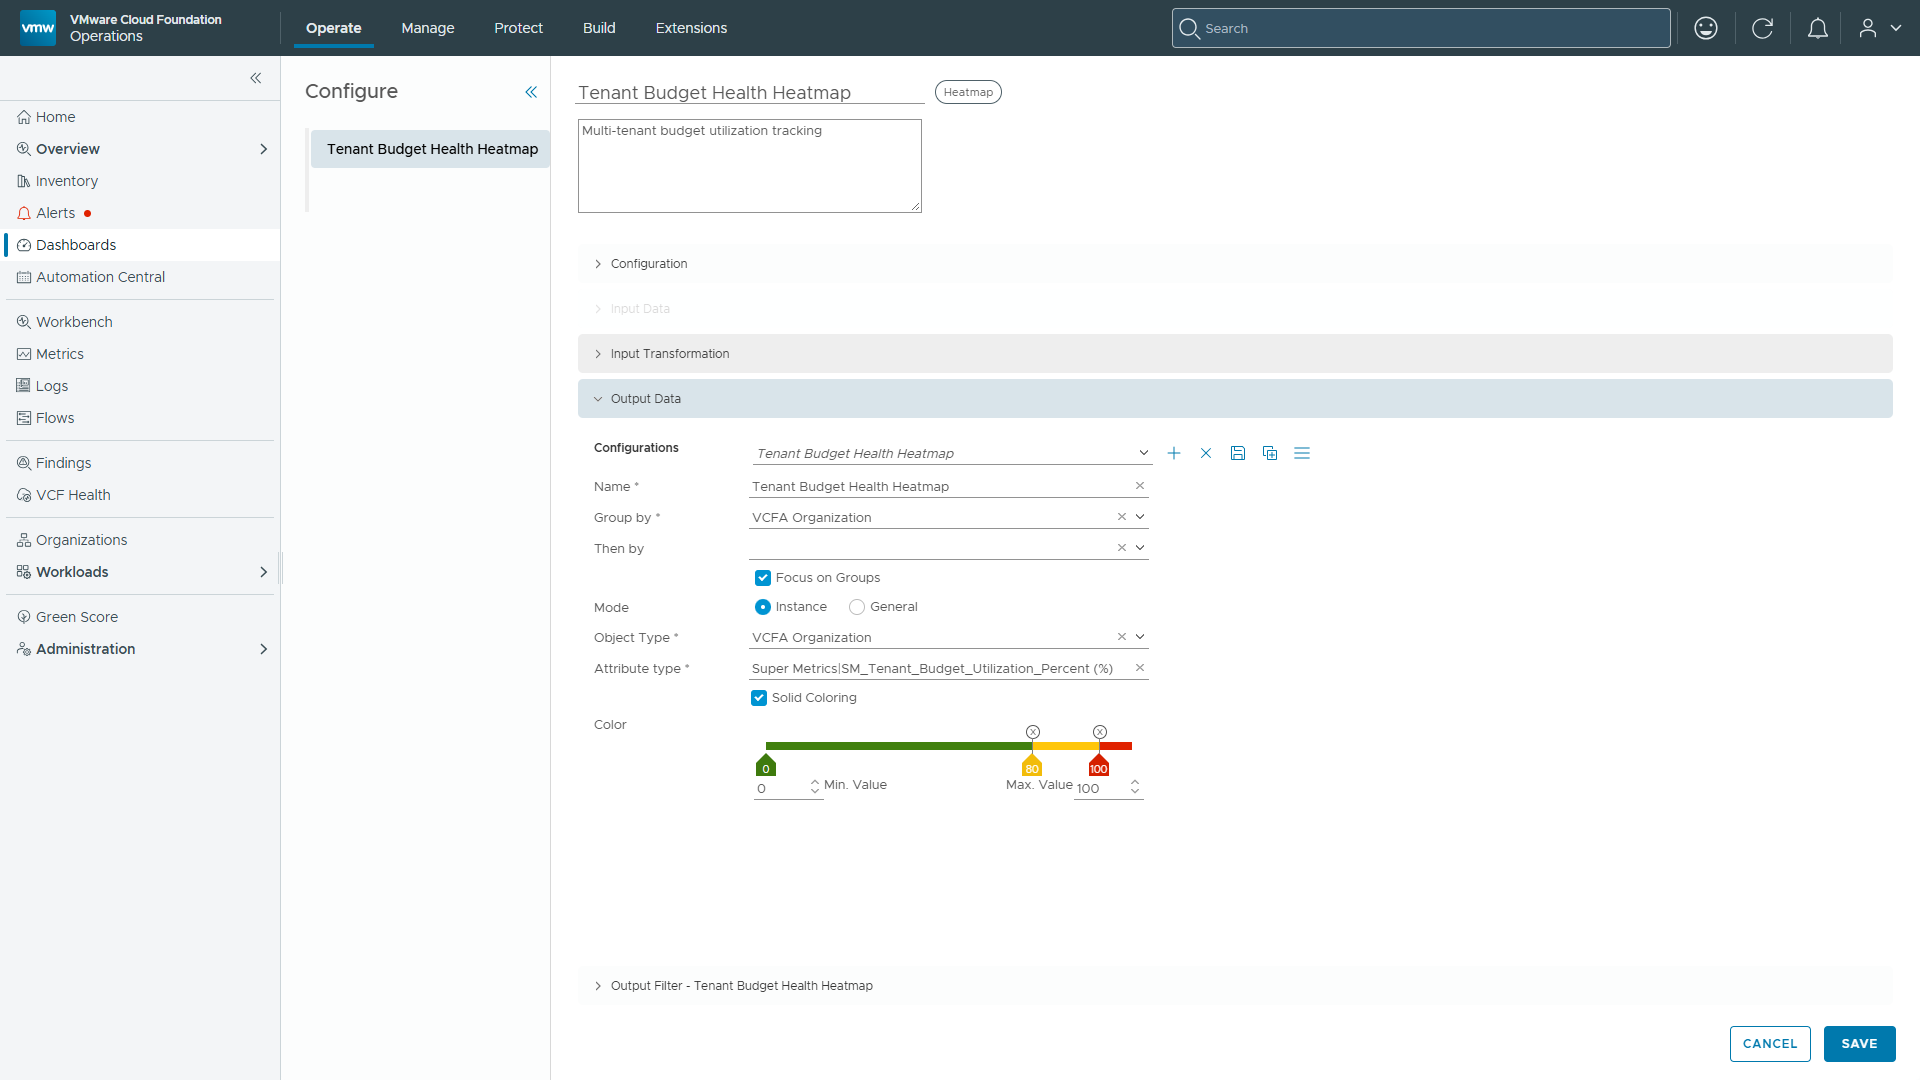
Section C: Color Gradient and Thresholds
-
- Select the checkbox for Solid Coloring.
- Set Min Value to 0 (Green).
- Set Value to 100 (Red).
- Drag or update the middle threshold node to 80 to represent your warning boundary and select Yellow.
Operational Note (Optional): If you want a 4-tier status representation (e.g., Green , Yellow , Orange , Red ), you can click anywhere along the bar to add another node.
5. Click SAVE at the bottom-right corner of the configuration screen.
Step 3: Add the Active Financial Guardrail Alerts Widget (Optional Companion)
To display active budget warning alerts alongside the visual heatmap blocks:
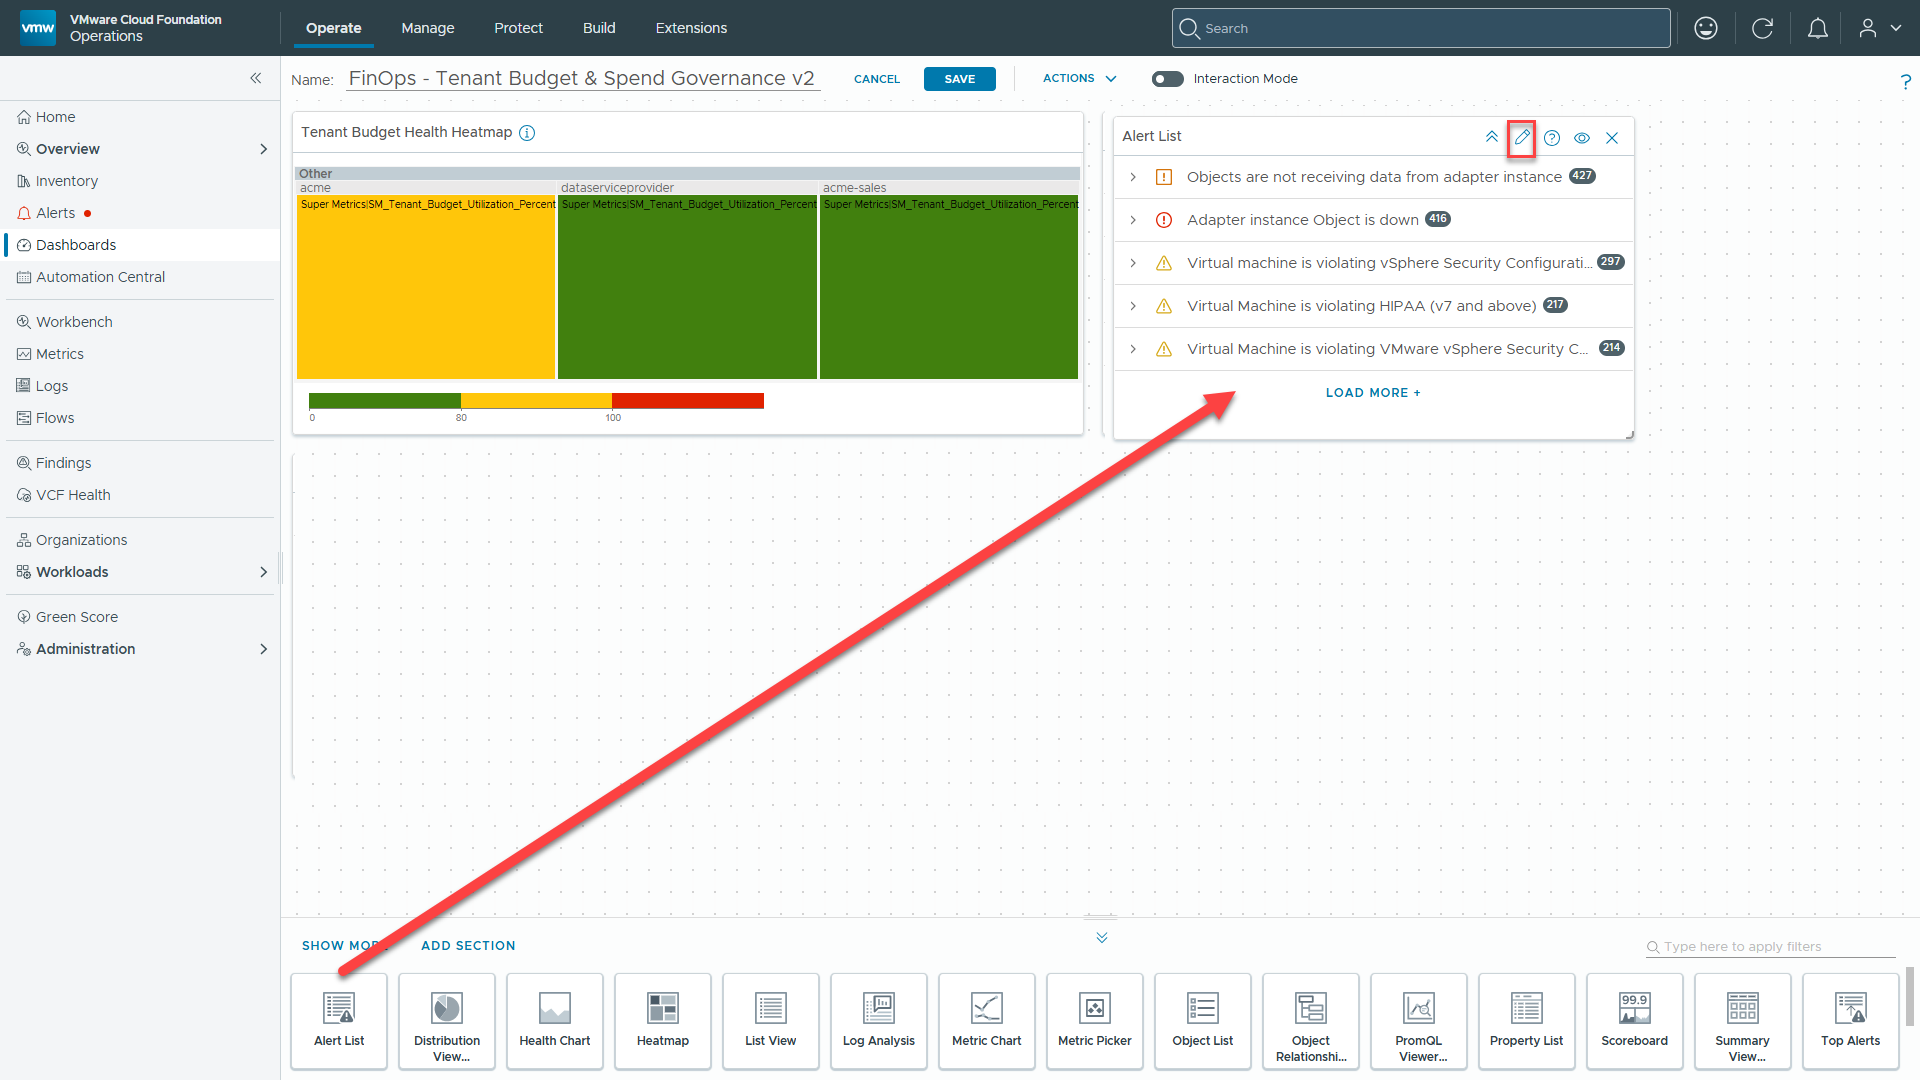
- Drag an Alert widget onto the dashboard canvas next to or below the Heatmap.
- Click the Pencil icon (Edit Widget) on the Alert widget.
Section A: Widget Header
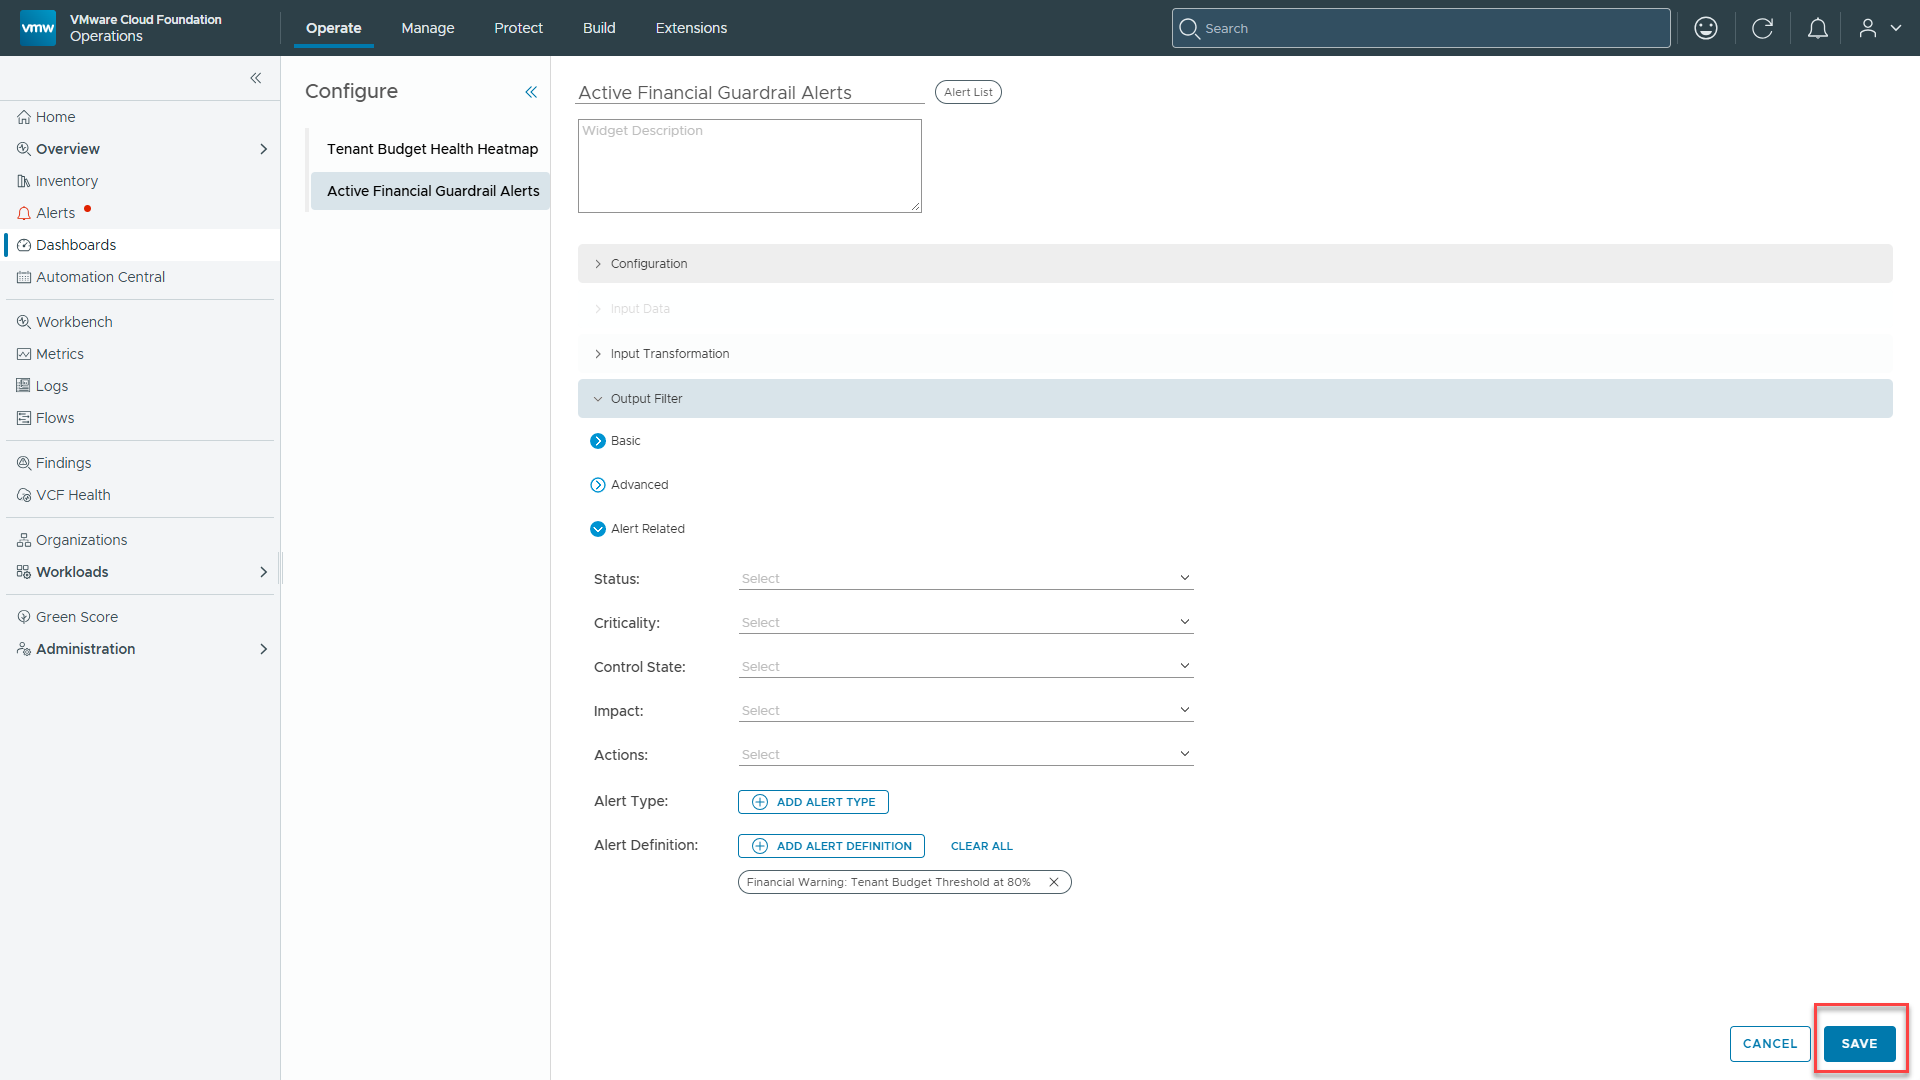
- Set the Title to Active Financial Guardrail Alerts.
Section B: Output Filter Accordion Configuration:
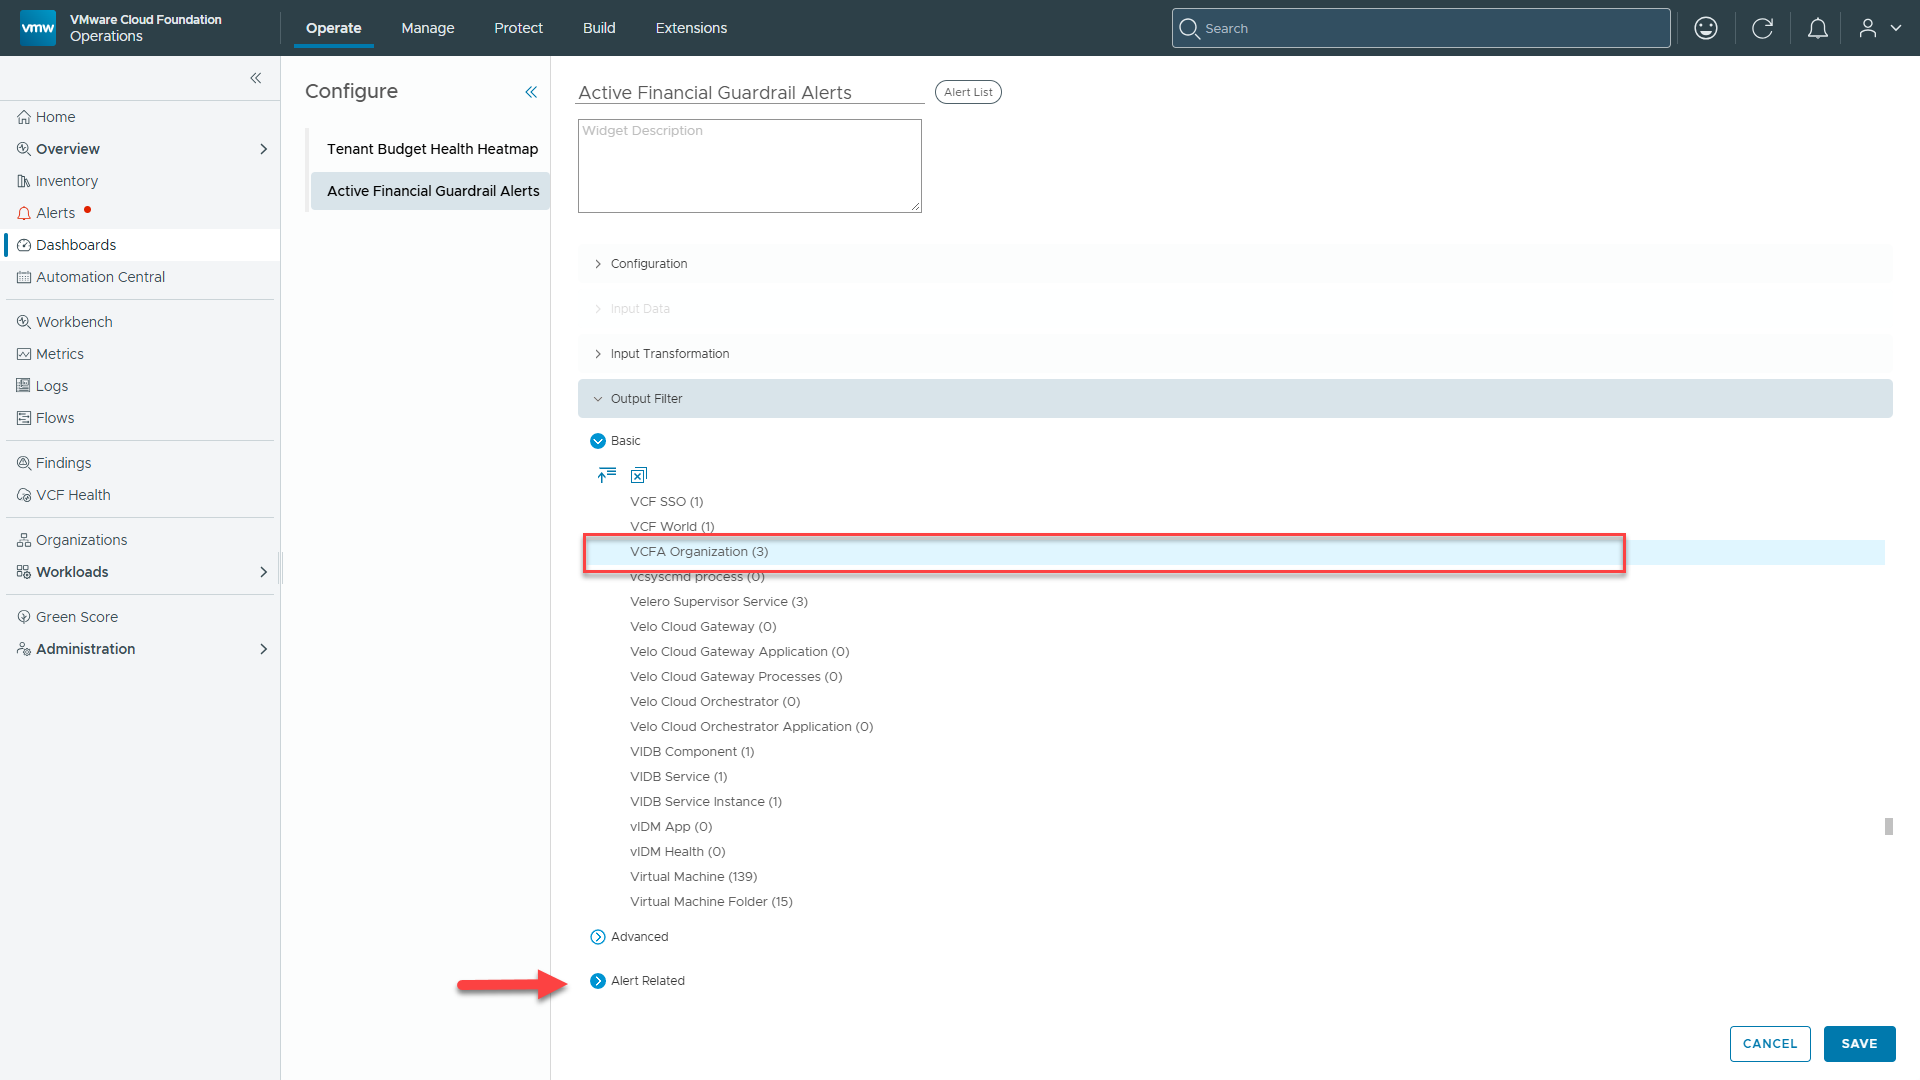
- Expand Output Filter Basic.
- Scroll through the object types list and select VCFA Organization(#).
Operational Note: In VCFA Organization(#), the number in parentheses indicates your total tenant organization inventory count. In this case, there are now three tenants in the VCFA Organization.
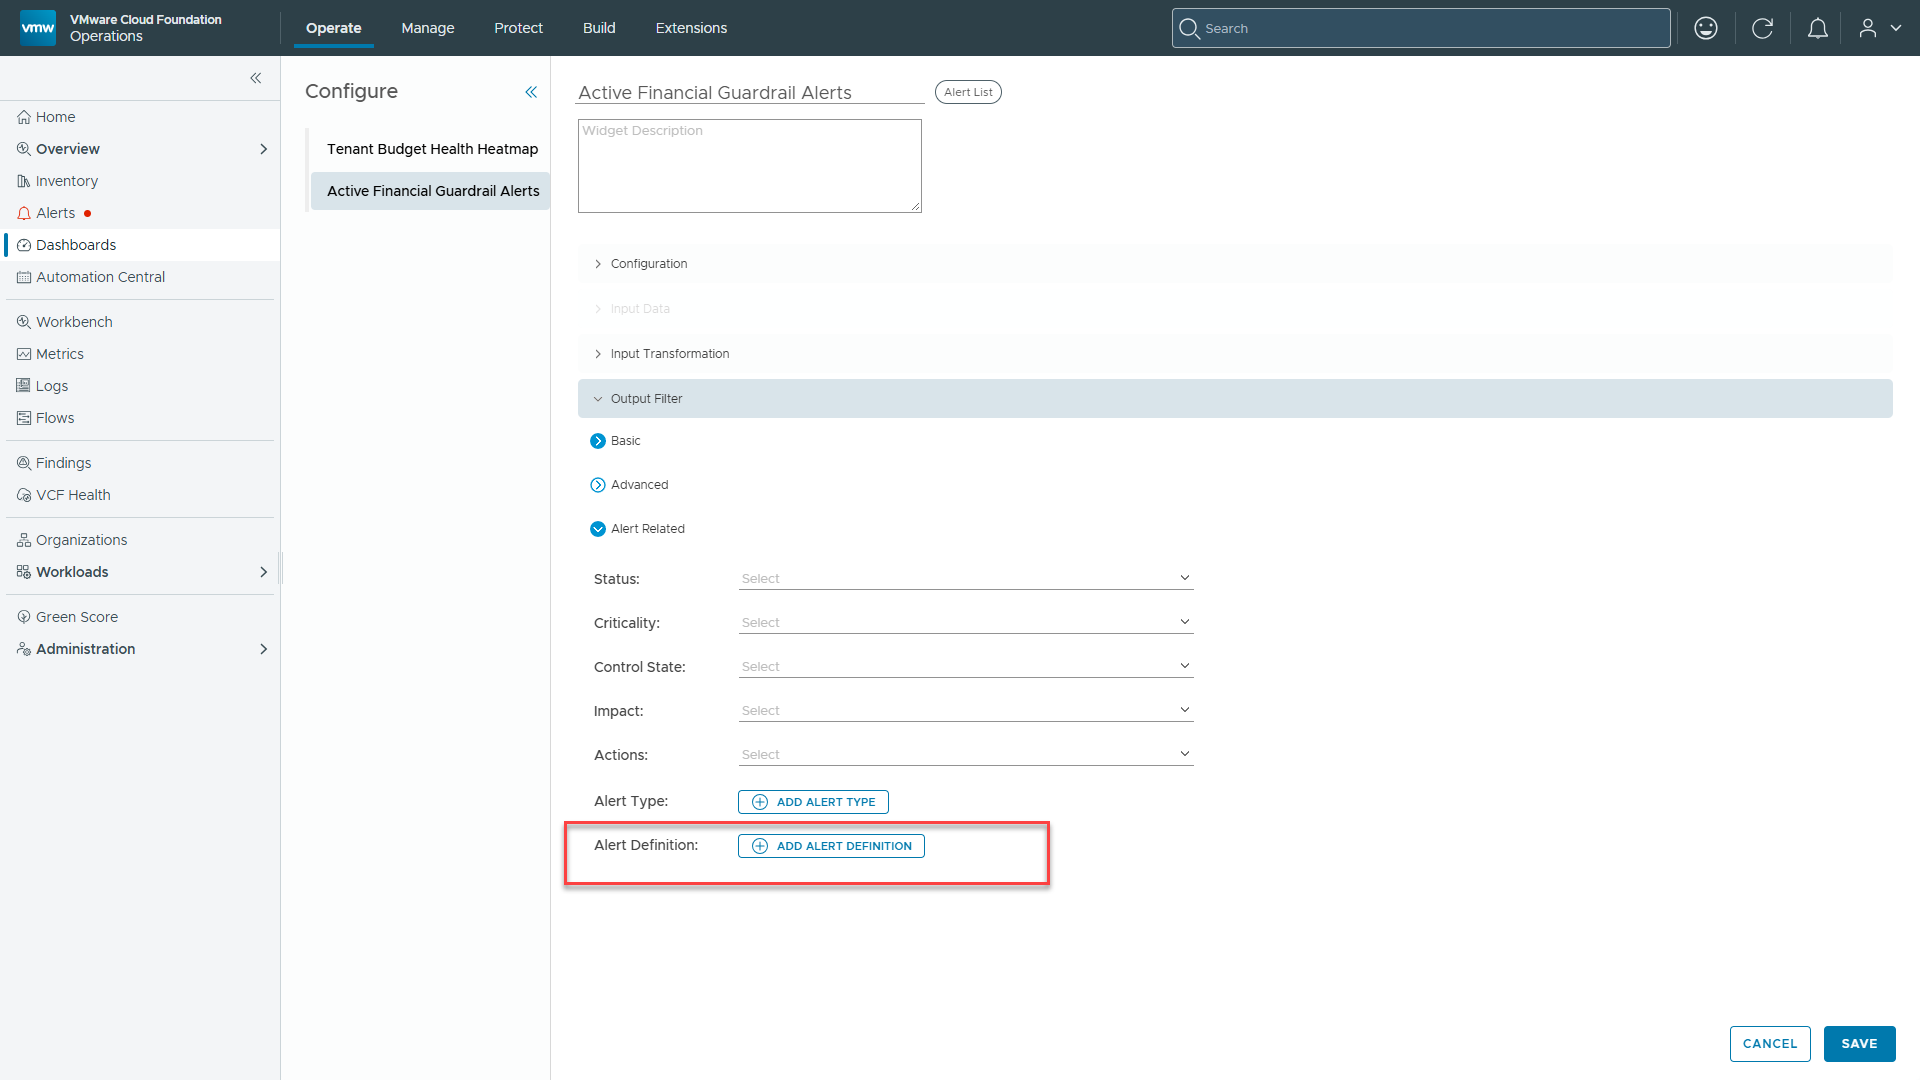
3. Expand Alert Related at the bottom of the Output Filter panel.
4. Click Alert Definitions: Add Alert Definition
5. Search for and select your specific alert rule: Financial Warning: Tenant Budget Threshold at 80%.
6. Drag and drop it to the empty field on the left.
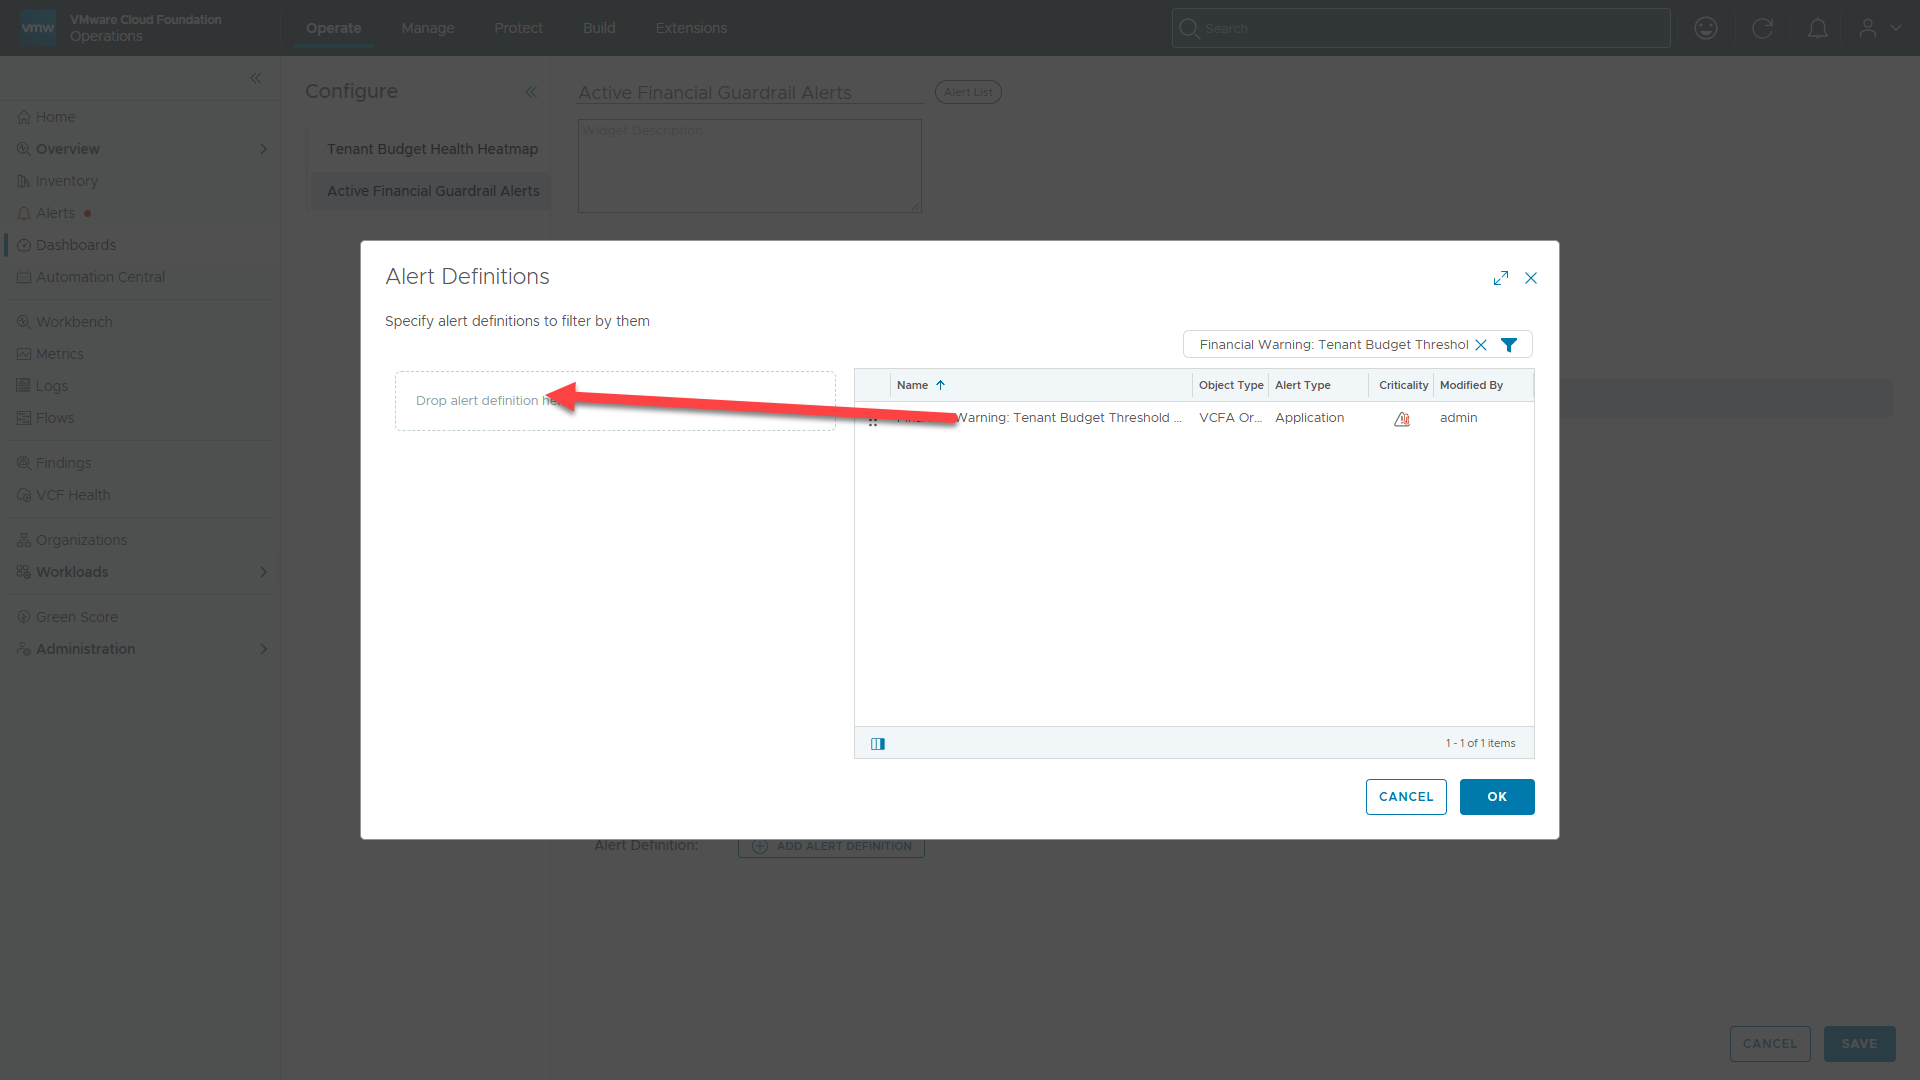
7. Click OK.
8. Click SAVE at the bottom-right corner.
Step 4: Save and Launch the Dashboard
- Click SAVE in the top-right corner of the main dashboard builder canvas.
- Navigate back to Operate > Dashboards > All and launch FinOps – Tenant Budget & Spend Governance.
Verified Dashboard Behavior and Executive Impact
The completed dashboard completes the end-to-end FinOps lifecycle within VCF Operations.
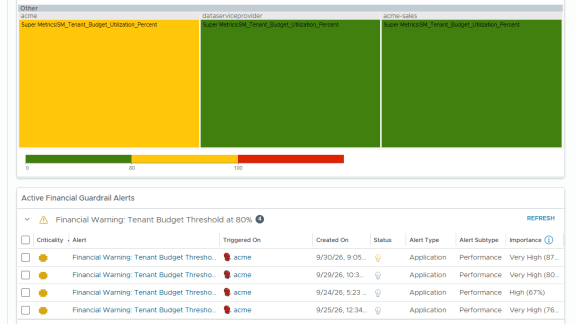
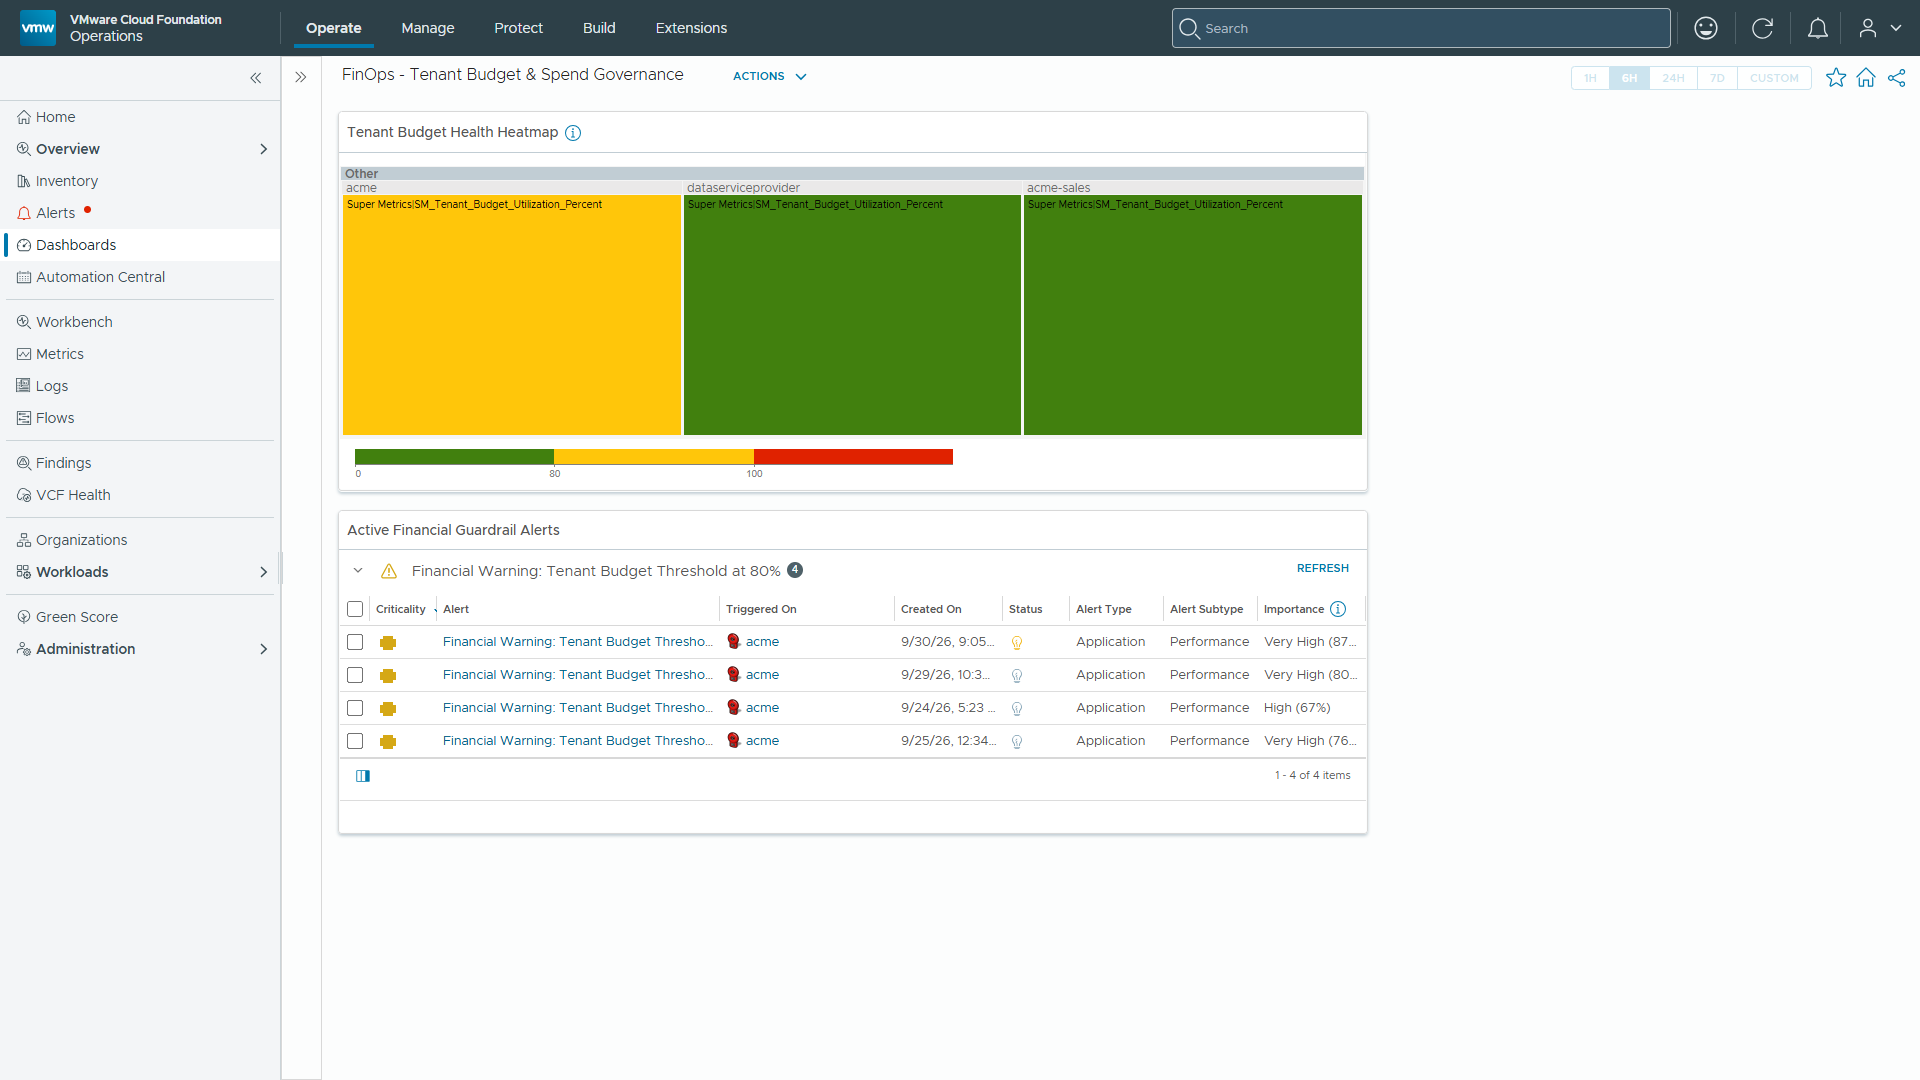
- Visual Multi-Tenant Heatmap: Automatically plots wrapped tenant organizations (acme, acme-sales, etc.) as dynamic tiles. Tiles automatically transition across color-coding (Green, Yellow, Red) based on current burn rate against Monthly_Budget.
- Alert Consolidation: The companion Alert List widget aggregates all active 80% threshold warning alerts for violating tenant organizations, providing immediate diagnostic details, timestamps, and criticality ratings.
- Executive Decision Velocity: C-level leaders and FinOps practitioners gain a forward-looking view of private cloud spend—allowing proactive quota adjustments, VM rightsizing, or resource cleanup before monthly budget caps are breached.
Conclusion: Continuous FinOps Governance in Motion
Dashboards in private cloud governance are often relegated to static reporting: artifacts reviewed during monthly cost allocation meetings long after capital has been spent. By contrast, the FinOps Tenant Budget & Spend Governance Dashboard built in VCF Operations operates as an active financial control panel, bridging the gap between infrastructure telemetry and board-level fiscal accountability.
By pairing continuous heat-map visualization with live 80% threshold guardrail alerts, IT leadership and FinOps practitioners achieve three immediate strategic outcomes:
- Intra-Month Burn-Rate Control: Infrastructure spend is no longer a month-end surprise. Operations teams gain immediate visual feedback as tenant organizations approach their fiscal limits, providing the runway needed to audit unattached storage, clean up orphaned snapshots, or adjust capacity quotas before overruns occur.
- Policy Standardization Across Multi-Tenant Fleets: Whether governing two tenant accounts or two hundred, the combination of Custom Group metadata containers and policy-scoped Super Metrics enforces uniform, automated financial guardrails across every business unit without adding administrative overhead.
- Demonstrable Private Cloud ROI: By bringing dynamic fiscal governance to private cloud workloads, technology leaders fulfill the ultimate promise of enterprise FinOps: pairing self-service agility with predictable, margin-protective economic control.
With the backend alert engine active and the executive dashboard online, your VMware Cloud Foundation environment transforms spend governance from a reactive administrative burden into a continuous, system-enforced discipline.
Discover more from VMware Cloud Foundation (VCF) Blog
Subscribe to get the latest posts sent to your email.


