

Authors: Yifan Hao, Yuankun Fu, Dongyun Heo, Jinsung Heo, Michael Furman, Rajesh Venkatasubramanian, Haoqiang Zheng, Kyung Min Park, Ramesh Radhakrishnan, Ashish Kaila, Yuichi Ui
Samsung: Young-Jun Hong, Mokmin Park
For organizations running Electronic Design Automation (EDA) workloads and High-Performance Computing (HPC) in virtualized environments, achieving near bare-metal performance is essential. One key challenge we identified is the performance impact caused by differences in memory access latency. In collaboration with Samsung, we have been investigating how to minimize this gap between bare-metal and virtualized platforms, particularly as observed with the memtest benchmark. Our analysis shows that the use of huge pages plays a crucial role in improving performance.
In this blog, we share the progress made by the VCF engineering team in understanding memory access latency behavior and provide guidance on tuning systems to achieve optimal performance for HPC workloads.
The Challenge: Memory Latency in Virtualization
In our internal profiling of Intel® Sapphire Rapids, we’ve observed that virtualization can introduce some variance in memory latency compared to bare-metal configurations, primarily during high-demand phases where Translation Lookaside Buffer (TLB) misses are more frequent. In other words, as more memory pages are actively in use, the system experiences more frequent TLB misses, and the cost of handling those misses is amplified under virtualization.
Why does this happen? When running inside a virtual machine, the translation from virtual memory to physical memory involves an additional level of indirection, requiring more page table state to be cached and managed. The hardware TLB, however, has a fixed capacity and can only cache a limited number of translations. Once the working set exceeds this capacity, the system must walk the page tables more often—and each page walk in a virtualized environment is more expensive than on bare metal.
To illustrate the magnitude of this effect, our measurements show that memory access latency can increase by ~12% once the TLB is under pressure. The remainder of this blog explores why this happens in detail, and how tuning page sizes—especially through the use of huge pages—can dramatically reduce this overhead.
The Solution: Harnessing the Power of Huge Pages
The VCF engineering team recommended enabling huge pages because they allow each TLB entry to map a larger portion of virtual memory – increasing TLB coverage, minimizing TLB misses, and cutting costly page walks. However, Samsung initially observed no performance gains. The issue was that the memtest application used malloc by default and wasn’t configured to allocate huge pages, even though the VM was already set up for 1 GB huge pages using the following advanced parameters:
|
1 2 3 4 5 6 7 8 9 |
# Enabled 1 GB huge page for the VM sched.mem.lpage.enable1GPage = "TRUE" # Reserve all guest memory on the host (equivalent to the UI option “Reserve all guest memory”). # This ensures the VM’s memory is fully reserved and not available for other VMs. # This option is optional since huge page doesn't rely on it. # It eliminatse the potential overhead when hypervisor needs to allocate pages on the fly, # but at the same time it also reserves memory of vmx process that might not be used at all. sched.mem.pin=TRUE |
Once memtest was updated to allocate huge pages via mmap, memory access latency in the VM dropped significantly. When Samsung ran this modified benchmark in their production environment, it achieved over 97% of bare-metal performance. Samsung also confirmed that their real production workloads—with huge pages enabled in both the guest OS and the application—reached similar performance levels, demonstrating that the improvement extends beyond synthetic testing.
It is worth noting that our changes to memtest were made only to demonstrate the effect of huge pages. Most performance-sensitive commercial HPC and EDA applications already support huge page allocation through standard huge-page-aware memory interfaces.
Optimizing an application to use huge pages, combined with appropriate VM configurations, generally leads to superior performance for memory latency-intensive workloads compared to default settings. To effectively leverage huge pages, follow these steps:
- Configure VM parameters: Add
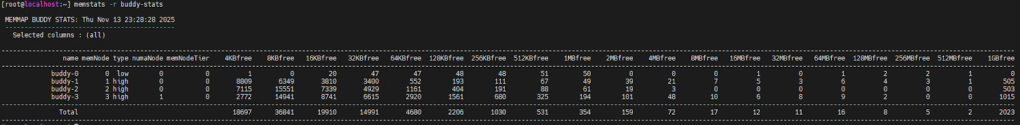
sched.mem.lpage.enable1GPage = "TRUE"to the VM’s advanced parameters. Before powering on the VM, you can verify the availability of various page sizes by runningmemstats -r buddy-statson the ESX host. The following screenshot shows there are a total of 2023 1GB free pages in ESX on a 2TB memory server. Then specify your desired memory size for the VM and power it on.
- (Optional) Monitor large page backing status in ESX. Firstly, execute the
vsishin ESX, then runcat /memory/lpage/vmLpage/<your-new-VM-vmx-world-id>. You will observe that the“Current number of 1GB page backings”number gradually increases until the VM is fully powered on. As illustrated below, A VM requiring 1900GB of memory is backed by 1900 1GB pages. While VM memory can be overcommitted, achieving optimal HPC workload performance necessitates that the VM’s specified memory size is entirely backed by available 1GB free pages, excluding any additional 2MB page backing. For instance, overcommitting a VM with 1960 GB of memory but observing only 1941 1GB page backing with additional 8605 2MB pages is suboptimal. It’s also important to note that VMs with larger memory capacities typically require a longer power-on time.
- Enable huge pages in the guest OS: Ensure the guest operating system has huge pages or Transparent HugePages (THP) enabled. Consult your guest OS vendor for specific instructions on how to do this correctly, as the process varies slightly between systems. E.g., by running
cat /sys/kernel/mm/transparent_hugepage/enabledto check the THP status in the guest OS (e.g., Ubuntu, CentOS or RHEL etc). - Verify application support: Customers should consult their application vendors to confirm if their applications support huge page utilization.
Theoretical Analysis
To illustrate the impact of huge pages, we used a simplified TLB coverage model rather than the real complicated model in contemporary CPUs. This model assumes a unified TLB cache for ease of explanation. In reality, modern CPUs have a more complex TLB hierarchy—L1 TLBs often separate code and data pages and maintain distinct entries for 4 KB and 2 MB pages, while L2 TLBs are usually unified, and 1 GB pages may be managed by a separate structure.
Within this simplified framework, we considered the following parameters:
- TLB Entries: Representative small, medium, and large configurations with 64, 256, and 2048 entries.
- Page Sizes: 4 KB, 2 MB, and 1 GB.
- Working-Set Sizes: A common large-application workload (8 GB) and a very large workload (64 GB).
- Coverage Calculation: Coverage was defined as the product of TLB entries and page size. A rough approximation of the hit rate was taken as the fraction of the working set covered by the TLB, assuming uniform memory access.
Note: This model is intended only to show the scale of the potential impact of huge pages. Actual TLB hit rates depend on access locality, replacement policies, CPU microarchitecture, and the mix of page sizes in use.
The following tables demonstrate the amount of memory the TLB covers for different page sizes and TLB entries.
| Page size | TLB entries | Coverage | Coverage of an 8GB workload | Coverage of a 64GB workload |
| 4 KB | 64 | 0.000244 GB | 0.0031% | 0.00038% |
| 4 KB | 256 | 0.000977 GB | 0.0122% | 0.00153% |
| 4 KB | 2048 | 0.007812 GB | 0.0977% | 0.0122% |
| 2 MB | 64 | 0.125 GB | 1.5625% | 0.1953% |
| 2 MB | 256 | 0.5 GB | 6.25% | 0.7813% |
| 2 MB | 2048 | 4.0 GB | 50% | 6.25% |
| 1 GB | 64 | 64.0 GB | 100% | 100% |
| 1 GB | 256 | 256.0 GB | 100% | 100% |
| 1 GB | 2048 | 2048.0 GB | 100% | 100% |
This demonstrates huge page advantages:
- 4 KB Pages: Even a large 2,048-entry TLB covers only ~0.01% of a 64 GB working set, causing frequent TLB misses.
- 2 MB Pages: A 2,048-entry TLB covers 4 GB, achieving ~50% coverage for an 8 GB working set—a significant improvement.
- 1 GB Pages: Just 64 TLB entries cover 64 GB, potentially eliminating TLB misses for many workloads.
The primary benefit of huge pages is that each TLB entry maps a substantially larger amount of virtual memory. This increases TLB coverage, drastically reducing misses and expensive page walks.
Performance Evaluation of Huge Pages
To evaluate the impact of huge pages on memory latency-sensitive workloads, experiments were conducted using memtest on ESXi 8.0 Update 3e (Build Number 24674464, released on 2025/04/10). The memtest application was modified to utilize 2 MB huge pages, with the source code available at https://github.com/YustasSwamp/memory-latency.
We conducted experiments in several generations of Intel CPUs (Cascade Lake, Ice Lake, and Sapphire Rapids). The following numbers are based on two different CPU architectures:
| Codename | Sapphire Rapids | Ice Lake |
| Model name | Intel(R) Xeon(R) Platinum 8452Y | Intel(R) Xeon(R) Gold 6330 CPU |
| Cores | 36 cores/socket | 28 cores/socket |
| Frequency (base/max) | 2.0 GHz / 3.2 GHz | 2.0 GHz / 3.1 GHz |
| Hyperthreading | Disabled | Enabled |
| Memory | 512 GB | 512 GB |
| Sub-Numa Clustering | Enabled | Disabled |
| Prefetching (BIOS) | – | Disabled |
| Power Management (BIOS) | – | High Performance (not allow the OS to manage) |
The behavior can be reproduced in various VM configurations. To avoid confusion, we present one configuration from each hardware setup above to keep our focus.
| Codename | Sapphire Rapids | Ice Lake |
| Virtual CPU | 72 | 28 |
| Virtual Memory | 512 GB | 64 GB |
| CPU reservation | None | Full |
| Memory reservation | None | Full |
| Latency sensitivity | Normal | High |
| Cores per Socket | 36 | 28 |
| VM advanced configuration settings | sched.mem.lpage.enable1GPage = “TRUE” | |
| Guest OS version | Centos 8.1 | Ubuntu 22.10 |
| Guest OS setting | Enable Transparent HugePage | Enable Transparent HugePage |
Result Comparison
Ice Lake
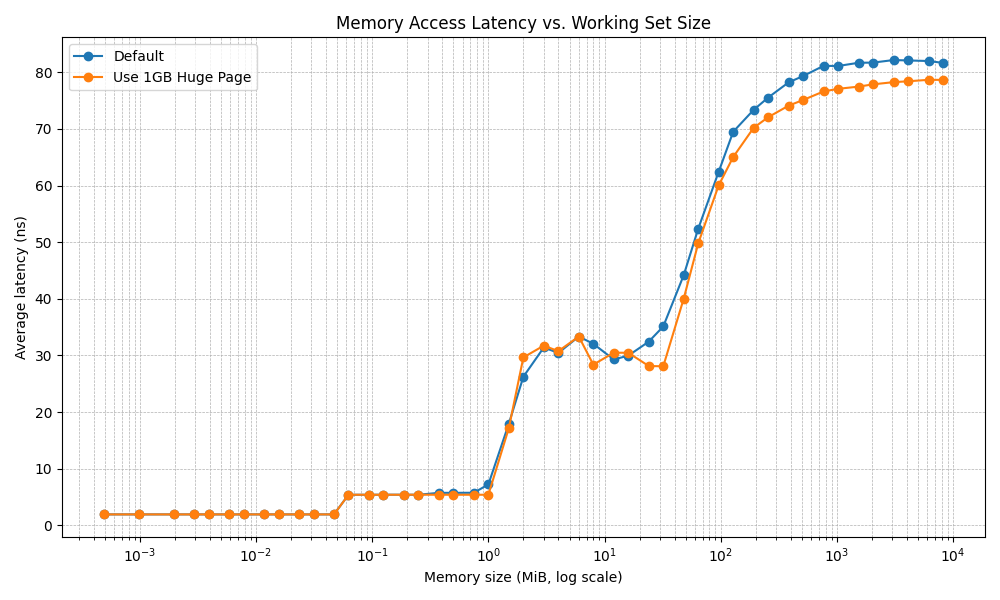
For our Ice Lake experiment, we focused on data within a virtualization environment. The graph below illustrates memtest latency using two command lines:
|
1 2 |
./memtest -l 64 -s 512 -m 8192 ./memtest -l 64 -s 512 -m 8192 -v (The -v option forces the modified version of the application to utilize 1 GB huge pages.) |
The results show a consistent improvement in latency when employing 1 GB huge pages, particularly when the working set size exceeds the L3 cache size.
TLB Cost
To further investigate the relationship between TLB cost and memory latency disparities, we modified the memtest application to include a measurement of the TLB miss rate. The TLB miss rate, expressed as a percentage from 0-100%, is calculated by dividing the number of TLB misses in the L3 data cache by the number of retired instructions. A higher percentage indicates more TLB misses.
The counters used for this measurement are PERF_COUNT_HW_CACHE_DTLB and PERF_COUNT_HW_INSTRUCTIONS. In order to use the performance counters within the guest OS, the VM was activated with the virtual CPU Performance Counter by Edit Settings > Expand CPU > select the Enable virtualized CPU performance counters check-box.
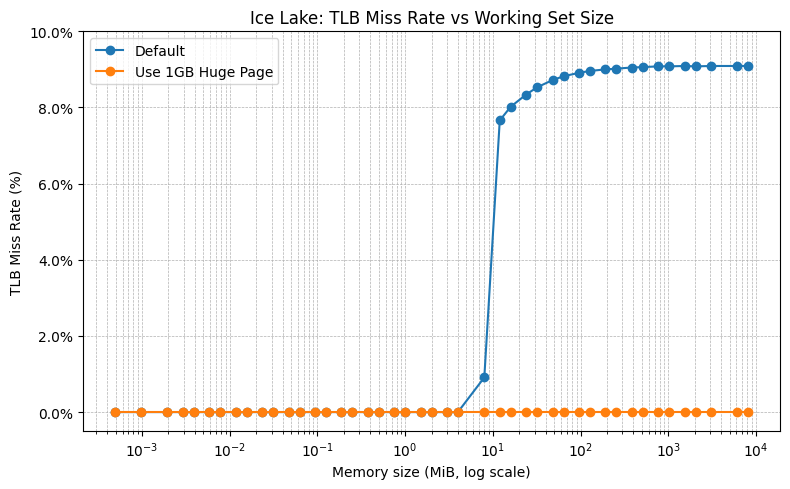
The figure below illustrates the TLB miss rate in the Ice Lake VM under two conditions: the default memtest configuration without huge pages, and with 1 GB huge pages. Without huge pages, the TLB miss rate approaches 9% as the working set size increases. Conversely, when 1 GB huge pages are utilized, TLB misses are virtually eliminated.
Sapphire Rapids
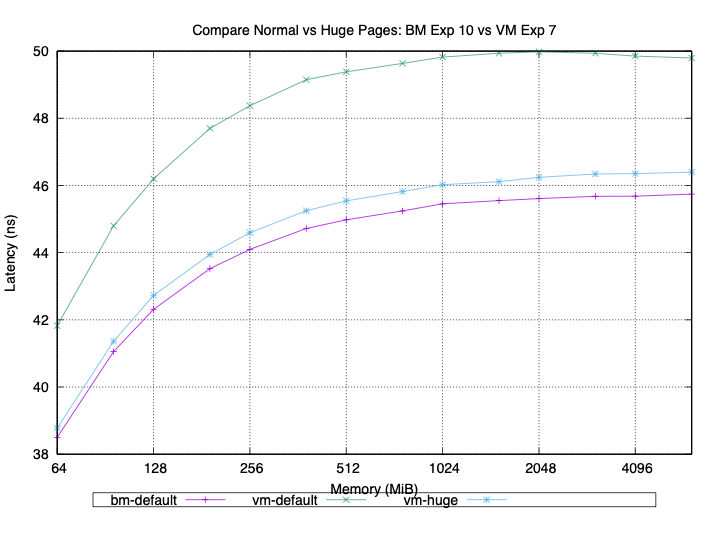
We also conducted our testing on a few different Sapphire Rapids servers. Our results were consistent across all of them. With 4 KB (small) pages, we consistently saw about a 5% increase in latency on the VM compared to the bare metal run on the same machine. When we configured the memtest application to use huge pages (2 MB or 1 GB), the latency of both the VM and bare metal was reduced.
Summary of Huge Page Settings
Our tests indicate that huge page settings are crucial for improving memory latency for workloads with a large working set.
When huge page settings do not help
- Small working set: If your working set is small and therefore pressure on TLB is small, huge pages offer little benefit.
- Scattered access: If accesses are sparse, the practical hit rate remains poor.
- Fragmentation: An OS’s inability to allocate contiguous physical memory for 2 MB/1 GB pages limits or prevents huge page use.
- Copy-on-write (CoW) / frequent small writes: CoW can negate huge-page benefits by forcing splits.
- Other bottlenecks: Remote NUMA latency, memory bandwidth, or I/O latency will not be improved by reducing TLB misses.
Additional Practical Notes
- CPUs have separate TLB structures (L1, L2/L3); some support special or mixed huge-page entries.
- Virtualization: Huge pages significantly reduce guest→host page-walk steps under nested paging.
- Tradeoff: Huge pages reduce TLB misses but increase internal fragmentation and demand for contiguous physical memory.
Quick Takeaways
- For large, stable, mostly-resident working sets (databases, caches, ML models), huge pages significantly reduce TLB misses and effective memory latency.
- For small, dynamic, or fragmented working sets, huge pages offer little benefit or can even be detrimental.
Other Settings to Consider to Improve HPC Application Performance in VCF
Determine When to Use Latency Sensitivity Mode
Setting LatencySensitivity (LS) = high is recommended for primary VMs that demand dedicated CPU resources, especially when multiple VMs operate on a single host. This setting is also crucial for network latency-intensive workloads, such as running MPI applications in VCF.
Benefits of LS=high:
- Exclusive Resource Mapping:
LS=highensures a direct, exclusive mapping between virtual CPUs (vCPUs) and physical CPUs (pCPUs). This minimizes memory and network latency, leading to enhanced performance. - Reduced Latency: By dedicating resources,
LS=highsignificantly reduces the overhead associated with shared CPU access, which is vital for performance-critical applications. - Comprehensive Configuration: This setting applies to CPU, memory, and network configurations, though it does not turn on huge pages.
For a deeper understanding, refer to VIN2677BE – Extreme Performance Series: Performance Best Practices starting at the 19:16 time mark.
Determining Maximum CPU Reservation:
To determine the maximum number of CPUs that can be reserved for a VM when LatencySensitivity is enabled, consult page 22 of the paper VMware vSphere 7 Intel Select Solution for HPC.
Calculating Reserved Cores for ESXi Services:
You can calculate the CPU resources reserved for ESXi services as follows:
- Run
sched-stats: On ESXi, with no VMs powered on, execute the commandsched-stats -t groups | less -s. - Identify
resvMHz: TheresvMHzcolumn in the top row indicates the total CPU resources reserved for ESXi services. - Calculate Reserved Cores: Divide the
resvMHzvalue by the system’s MHz-per-core (e.g., CPU frequency from vSphere Client).- Example: If
sched-statsshows 10386 MHz in the host row and the CPU frequency per core is 2.99 GHz, then:10386 MHz / (2.99 * 1000 MHz/core) = 3.5 coresare utilized for vSphere services.
- Example: If
- Calculate Maximum User VM Cores: For a host with 48 physical cores, the maximum number of cores that can be fully reserved by a user VM is
floor(48 - 3.5) = 44 cores. - Configure VM Reservation: To configure the VM, reserve:
2.99 * 1000 MHz/cores * 44 cores = 131560 MHz.
Using High Speed Interconnect HCAs/NICs for MPI Workloads
We have previously published the following documents regarding the setup and performance benchmarks for running MPI applications at scale with LatencySensitivity=High:
- Virtualizing HPC on vSphere: Choosing a Best Method for RDMA HCA/NIC Deployment for MPI Workloads (across two different sets of 16 ESX hosts)
- InfiniBand Configuration on VMware vSphere 8
- VMware vSphere 7 Intel Select Solution for HPC (a virtual HPC Reference Architecture using SRIOV IB across 4 ESX hosts)
- InfiniBand SR-IOV Setup and Performance Study on vSphere 7.x (across 16 ESX hosts)
- RoCE SR-IOV Setup and Performance Study on vSphere 7.x (across 16 ESX hosts)
- InfiniBand and RoCE Setup and Performance Study on vSphere 7.x (Using Direct Path I/O with IB and RoCE separately across 16 ESX hosts)
- Performance Evaluation of HPC Applications on a Dell PowerEdge R650-based VMware Virtualized Cluster (Using SRIOV RoCE on 32 ESX hosts)
- Performance Study of HPC Scale-Out Workloads on VMware vSphere 7 (Using SRIOV RoCE across 16 ESX hosts)
Maximum Memory Reservation for a User VM
To identify the maximum allocable memory for a user VM, execute the following command:
|
1 2 3 4 5 6 7 8 9 10 11 12 13 14 |
# Use the user pool id (i.e., number 4) to check reserved and unreseraved memory in ESX ✗ vsish -e get /sched/groups/4/stats/capacity group-capacity { cpu-reserved:0 MHz cpu-unreserved:200760 MHz mem-reserved:216984 KB --> Enabled VCF services by user in ESX mem-unreserved:2106598528 KB --> Total memory size can be used by users mem-reserved DRAM:0 KB mem-unreserved DRAM:0 KB } # Alternatively, the following command can be used to verify the maximum amount a user can utilize for a VM. ✗ val=$(vsish -e get /sched/groups/4/stats/capacity | sed -n 's/^ *mem-unreserved:\([0-9]\+\) KB$/\1/p'); echo "$(expr $val / 1024 / 1024) GB" 2009 GB |
The example demonstrates that on a host with 2048GB of memory, ESX reserves 39 GB (1.9% of the total). This reserved memory is used by various VCF services, including DRS, HA, vSAN, and NSX. Users can attempt to allocate a little less than 2009 GB to their VM (e.g., 2008 GB), and if it fails to power on, they can iteratively decrease the memory by 10 GB to determine the maximum runnable capacity. Note that ESX reservation figures, and corresponding percentages, are not uniform and will differ across various servers and existing VCF services enabled. Future blog posts will explore methods to further reduce these reservations in upcoming ESX releases.
Reference
How is Virtual Memory Translated to Physical Memory?
RAN Workload Performance Is Equivalent on Bare Metal and vSphere – VMware Telco Cloud Blog
Discover more from VMware Cloud Foundation (VCF) Blog
Subscribe to get the latest posts sent to your email.


