
“How does the vSAN Express Storage Architecture (ESA) compare in performance to my storage array?” It is a question that we are often asked. We also wish there was an easy answer. Without knowing the myriad of variables in the data center, the most accurate answer is usually “It depends.”
It is, however, an important question to ask, and in this post we give a more detailed answer based on a large customer performing an evaluation of vSAN ESA against a popular storage array.
But let’s not make you wait. How did vSAN ESA compare to the customer’s top-tier, capacity-equivalent storage array? Here are some highlights.
- vSAN ESA delivered 20% higher IOPS with similar sub-millisecond latency in application-level testing.
- vSAN ESA delivered 70% higher IOPS with similar sub-millisecond latency in synthetic I/O storage testing.
- vSAN ESA delivered 61% lower latency under hardware failure conditions.
As if the performance advantages were not enough, the customer’s own estimates showed that this increase in performance using vSAN ESA will actually cost them 31% less than their existing array would have.
Yes, it was that much better. Let’s look into this further to better understand the results.
Complexities of Measuring Storage Performance
Second to perhaps data availability, delivering sufficient and consistent performance is one of the core responsibilities of enterprise storage solutions. But measuring storage performance in a manner that is meaningful to real world workloads is not easy. The storage industry has played a part in the confusion, where storage vendors tend to use sensational “hero numbers” of total potential performance derived from a storage system as a way to compare. Synthetic I/O generators have a place in evaluating storage solutions, but their results – that focus mostly on aggregate IOPS – do not tell you how much better or worse a specific application will perform. These synthetic I/O generators are also sometimes tailored to avoid known bottlenecks of a system in an effort to show overly optimistic numbers.
For our comparison, we wanted to avoid all of that. Fortunately, one of our very large customers in financial services allowed us to observe their evaluation of vSAN ESA against their existing top-tier storage array. They wanted to better understand the relative performance, and so did we.
A Realistic Direct Comparison
A large percentage of this customer’s workloads come from high-transaction databases using SQL servers. These types of workloads demand low and consistent latency, so they wanted to be sure that the evaluation of vSAN ESA, (and its comparison to a leading storage array) represented the real demands of the environment. They wanted to understand the performance of these workloads in three specific areas:
- Periods of high-volume transactions representing heavy trading conditions
- Periods of regular transactions rates they typically see during normal market trading.
- During failure conditions, such as a storage controller for an array, or a host failure for vSAN.
They also wanted to stress test each storage system with a traditional synthetic I/O generator. As a result, two types of tests were performed:
- SQL workload testing. This would represent the aggregate performance of 50 VMs running SQL server and performing an OLTP database simulation using a TPC-E like benchmark. The goal of this benchmark is to demonstrate the performance capabilities of a fixed set of 50 VMs, expressing how fast the collection of workloads can run. This TPC-E like benchmark attempts to simulate the OLTP patterns of a financial brokerage, and performs a complex set of non-storage tasks, so the total performance is limited by the application CPUs and the number of VMs in the simulation. It can be thought of as a “CPU bound test” as it does not measure the total potential performance of the storage system. This is the test that would also be used for performance under a failure condition.
- Synthetic storage I/O testing. This represents a simpler and more common approach to storage system testing. The goal of this benchmark is to demonstrate the potential performance of the entire storage system in the form of aggregate IOPS, throughput, and average latency. This stress tests the storage system to a degree to show its limit and can be considered a “storage-bound test.” FIO is the synthetic I/O generator used on both storage systems. HCI Bench (which uses FIO) is used on vSAN to help instantiate the correct number of worker VMs. The testing used 8KB block sizes with a 70/30 read-write ratio, which would represent the general I/O characteristics of the customer’s SQL VMs.
vSAN clusters can come in all shapes and sizes that can affect performance. For this test, a 6-host vSAN ESA cluster was used. Each host, which approximates a modest vSAN-ESA-AF-6 ReadyNode profile, had 56 CPU cores, 6 NVMe storage devices, 768 GB of RAM, and 25GbE networking. Using vSAN 8U3, all VMs were assigned a storage policy with a level of failures to tolerate (FTT) of 2, or FTT=2 using RAID-6
The Results
Let’s look at the results of these tests and decipher what they mean.
SQL Workload Test Results
This test attempts to show how a fixed number of applications would behave on the two storage systems if stressed with a high amount of transactions. Since this type of test simulates OLTP processing of financial applications, the percentage of difference between storage systems will typically be less than full synthetic I/O benchmarking that only stresses the backing storage..
Using the TPC-E like benchmark running on a set of 50 VMs, these VMs drove 150,000 IOPS at 0.93 latency on this vSAN ESA cluster. The same workloads backed by the competing storage array drove 125,000 IOPS at 0.8ms of latency. This means that the applications saw a 20% performance improvement with nearly the same average latency when using vSAN versus the competing storage array.
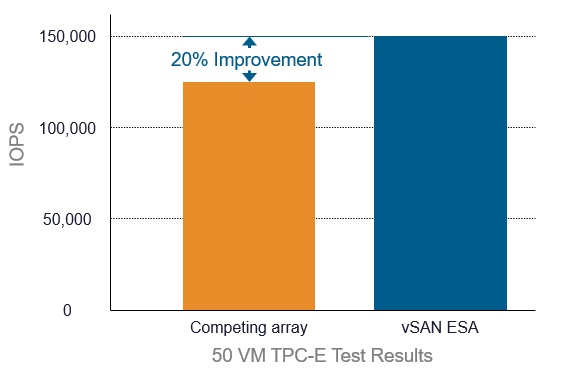
Figure 1. TPC-E application test results.
When the applications on the vSAN cluster were simulating a more modest transaction rate equal to their regular daily rate (35,000 IOPS), the average latency for the applications on vSAN dropped to 0.65ms.
Comparing the performance impact of a hardware failure was interesting. With a single host failure in vSAN, the average latency increased to 1.71ms, but was much lower than the 4.33ms that occurred on the storage array after a storage controller failure. The effective latency on the workloads was 61% lower on vSAN than it was on the storage array.
Synthetic Storage I/O Test Results
This test aimed to show the total aggregate performance of the storage system. This type of test will typically yield the largest percentage of difference between systems, since it is focused almost entirely on the storage system itself.
Using an 8KB block size at 70/30 read-write ratio, the 6 host vSAN ESA cluster drove 858,000 IOPS at 0.95ms latency. The competing storage array drove 500,000 IOPS at 1.0ms latency. In other words, the 6 host vSAN cluster provided a 70% increase in aggregate IOPS with comparable latency.
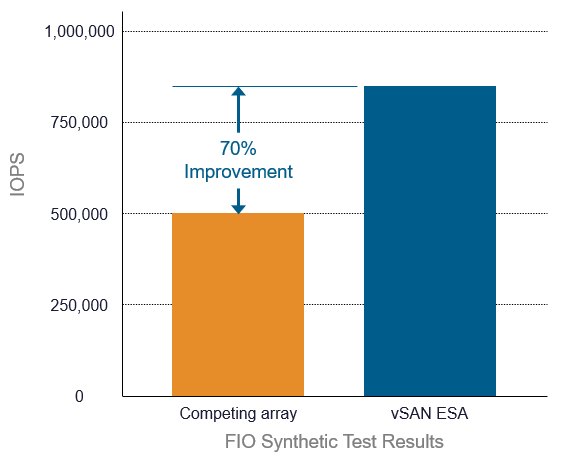
Figure 2. Comparing Synthetic Storage I/O results of competing arrays with vSAN ESA.
For the most demanding workloads where low and consistent latency is critical, the test results are decisive. vSAN ESA can deliver better performance for your VCF environment than a leading storage array. It allows your applications to run faster while maintaining sub-millisecond latency, and can deliver comparatively low latency during a storage failure.
The evidence above also aligns with what many of our customers have shared with us since the debut of vSAN ESA – that vSAN is faster than their other storage solutions. That is certainly what CID shared in the blog post “Moving Beyond Traditional Storage: How CID Redefined Performance with vSAN.”
Beyond Better Performance
It’s clear that vSAN ESA had no problem delivering superior performance when compared to the storage array tested by the customer. But the benefits of vSAN extend beyond IOPS, throughput and latency measurements. vSAN’s distributed architecture is truly scale-out. Whether it be for an aggregated vSAN HCI cluster, or a disaggregated vSAN storage cluster, each host you add to a cluster adds storage capacity, processing power and networking bandwidth. Best of all is that it does this in a linear and predictable way. It helps you avoid the technical and financial challenges with scaling traditional three-tier storage using modular arrays.
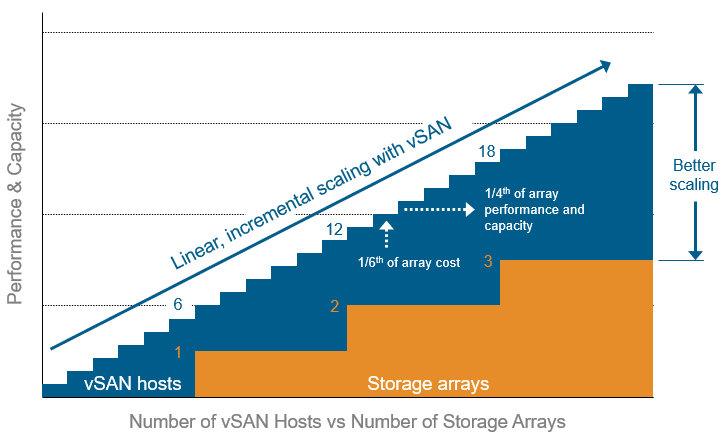
Figure 3. Linear scaling of capacity and performance with smaller incremental costs using vSAN
And we can’t forget about the cost. Given that VCF licensing includes 1TiB of vSAN capacity for every VCF core licensed, this resulted in vSAN delivering an effective cost per TB of 31% lower than their storage array in the customer’s environment, all while delivering much better storage performance.
Summary
The results say it all. vSAN is high-performance storage that can deliver better performance to your applications. It is built into the hypervisor, and a part of your VCF license. What are you waiting for?
Discover more from VMware Cloud Foundation (VCF) Blog
Subscribe to get the latest posts sent to your email.


