Skyline Health for vSAN plays a significant part in helping customers understand the health and well-being of their vSAN clusters. Included with all versions of vSAN, it actively monitors a cluster using dozens of integrated tests to ensure that a cluster is configured properly, and if there are any environmental conditions affecting the resources and data it serves.
Our engineering and product design teams have continually improved the capabilities of Skyline Health for vSAN over the years. We’ve introduced numerous new health findings (renamed from “health checks in all new versions of vSphere and vSAN) and introduced abilities to show the history of health findings and the correlation between triggered health findings.
vSAN 8 U1 introduces a new approach to monitoring the condition of a cluster that builds off the existing intelligence of our Skyline health engine. It pairs these past efforts with new techniques to help you easily answer the questions of, “Is my cluster and the workloads it serves in a healthy state? And if not, how severe is the condition? And how should it be resolved?“
Let’s look at what changed, and why it matters.
Solving the Problem of Priority
As found with past versions of Skyline Health for vSAN, health findings are commonly conveyed to an administrator through an enumerated list and their respective condition. This type of approach is not unusual for any type of monitoring solution. At first glance, this makes sense but is plagued by several challenges. A list of health findings does not convey any sense of the severity of the triggered health findings. Is it important, or just somewhat important? It also does not convey any sense of a category of impact. Is the triggered health finding impacting the availability of data, or is it a relatively benign finding that can be addressed later? A generic list also tends to treat the discrete health checks independently and arbitrarily and doesn’t showcase any built-in correlation between triggered health findings.
And finally, a list of health findings doesn’t give a good sense of the state of a cluster. Yes, we know if all the health findings are good, then that is a positive sign, but is a cluster with 9 triggered health checks necessarily in a worse state than a cluster with 5 triggered health checks? Depending on the type of triggered health check, the answer may be yes, or it may be no. What’s interesting about all these challenges is that the matter becomes worse as more health findings are added.
We solved all these problems in vSAN 8 U1, through the new Skyline Cluster Health Dashboard. It is available for clusters using the Express Storage Architecture (ESA) as well as the Original Storage Architecture (OSA).
Skyline Health Dashboard
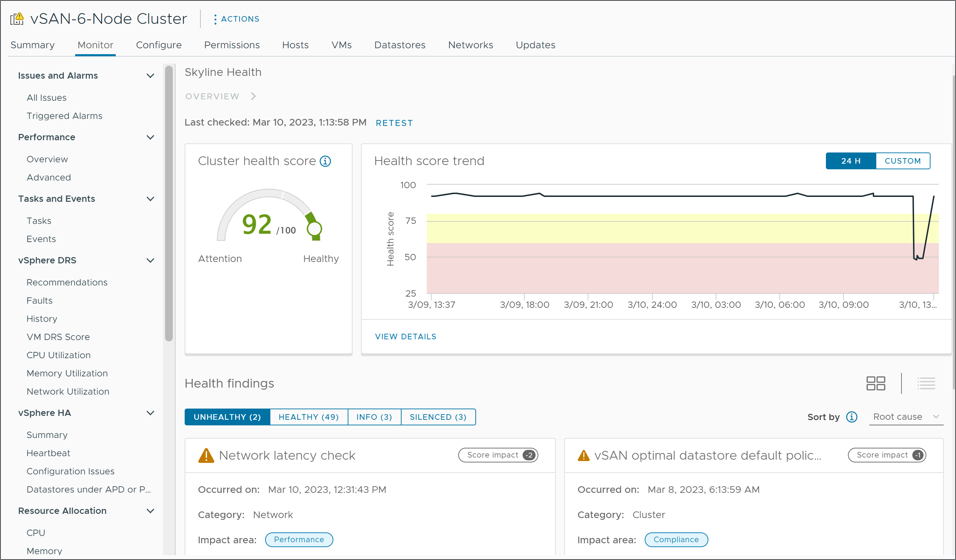
The new Skyline Health Dashboard takes much of the intelligence already built-in to the feature, such as relationships between health findings and health condition histories but builds on this with all new intelligence and an intuitive way to discern and address a cluster’s health condition. Figure 1 shows the three main areas of the new Skyline Health dashboard in vSAN 8 U1: The cluster health score, the health score trend, and the health findings.

Figure 1. The layout of the new Skyline Health dashboard in vSAN.
Let’s look at how we achieve this new level of intelligence in vSAN 8 U1.
Weighted Health Findings
At the heart of the new dashboard is a sophisticated weighting mechanism for each health finding built into vSAN. It will come up with a “weight” based on the following two ways:
- Category Impact. All health findings fall into one of four categories. They are “Availability,” “Performance,” “Capacity Utilization” and “Efficiency and Compliance.” These categories are weighted to align with typical administrator pillars of responsibility, where perhaps addressing matters regarding availability takes precedence over matters of compliance. Some categories like “Availability” have an additional level of distinction between data availability, and infrastructure availability to be more accurate in their scoring.
- Priority Impact. This helps give a weight to a triggered health finding within a category, aggregating the weight of the triggered health checks.
These factors, when combined will produce a unique weighted value, known as an “impact score” for each discrete health finding. This lays the foundation for the other functionality in the dashboard.
At-a-Glance Health Summary
Next is a cluster health score. This is a single value that ranges from 0-100, with 100 being a perfectly healthy cluster based on the conditions of the health findings. Triggered health findings will have their weighted score subtracted from 100 to produce a score representing the overall state of the cluster. The cluster score dial is divided into three ranges:
- 81-100 = On Target/Healthy. A score in this range means that no immediate attention is required.
- 61-80 = Degraded health. A score in this range means that attention is suggested but is not critical.
- 0-60 = Unhealthy. A score in this range indicates that immediate attention is required.
The weighting of the category impact and priority impact has been designed in such a way as to ensure that the score is impacted sufficiently based on the type of condition it finds. For example, any triggered health findings regarding the “Availability” category will always reduce the total cluster health score enough to move it into the “Unhealthy – Attention required” range. Note that triggered health findings that have been silenced will still impact the total score.
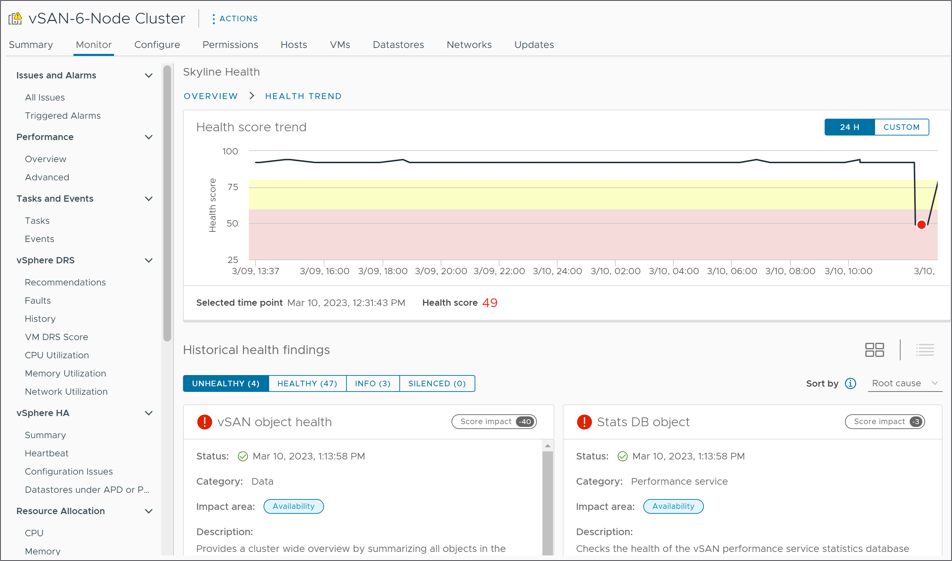
An interesting element of the cluster health score is the “Health score trend” which provides a historical view of the cluster health score. By clicking on “View Details” as shown in Figure 2, one can see the specific triggered health findings that resulted in the score for the time selected. It is an incredibly powerful feature.

Figure 2. Health score trend with associated health score findings for the time period selected.
Prioritized Remediation
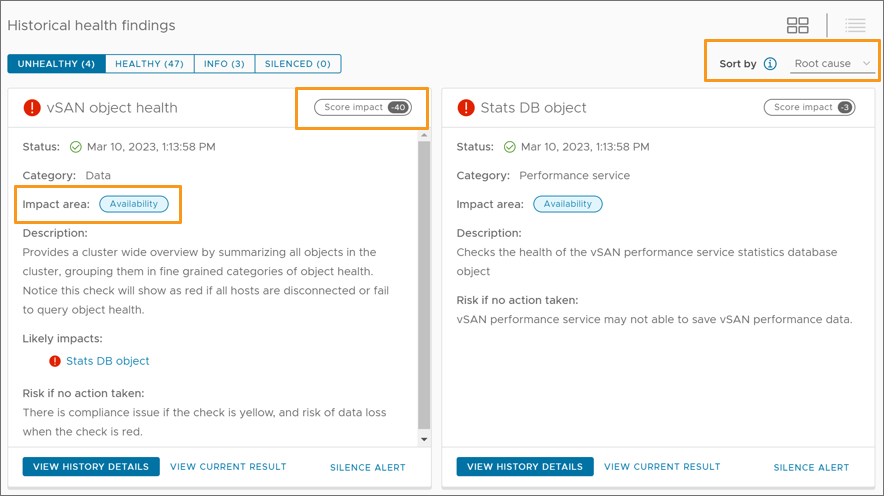
Weighted health findings do more than create a cluster health score. It plays a significant part to understand the prioritization of unhealthy findings. The default view will sort by the triggered findings that have the most impact and are identified by vSAN as a root cause of any secondary, symptomatic issues. This gives the administrator a definitive troubleshooting order when attention is suggested or required. For convenience, the view can also be sorted by the time in which it occurred, its status, the impact score, the category, or the impact area.
As shown below, you will see each finding will convey the score impact it has on the cluster score, as well as the impact area, or category. One thing to also notice is a very consistent way to remediate issues. Clicking on the “Troubleshoot” icon will often provide one or more ways to resolve the issue.

Figure 3. Examples of “unhealthy” findings and the additional information and guidance that is provided.
Summary
The cluster health scoring mechanism mimics the almost-subconscious approach that a seasoned administrator or technical support engineer would use to check the health of a vSAN cluster and remediate discovered issues. It will surely change how you approach the monitoring and troubleshooting of your vSAN clusters in the years to come.
Discover more from VMware Cloud Foundation (VCF) Blog
Subscribe to get the latest posts sent to your email.


