The vSAN performance service provides storage-centric visibility to a vSAN cluster. It is responsible for collecting vSAN performance metrics, and will present them in vCenter. A user can set the selectable time window from 1 hour to 24 hours, and the data presented uses a 5-minute sampling rate. The data may be retained for up to 90 days, although the actual time retained may be shorter based on environmental conditions.
Levels of Navigation
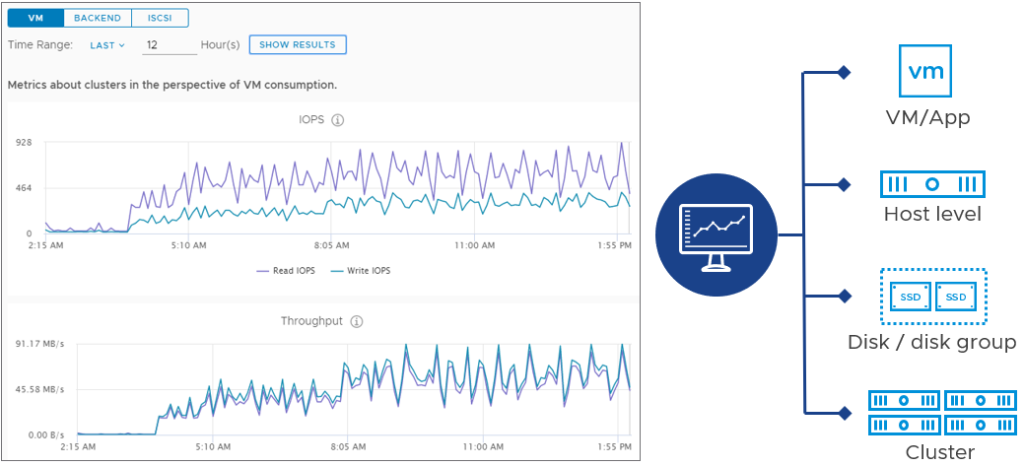
The vSAN performance service it presents metrics at multiple locations in the stack. As shown in Figure 1, vSAN related data can be viewed at the VM level, the host level, the disk and disk group level, and the cluster level. Some metrics such as IOPS, throughput, and latency are common at all locations in the stack, while other more specific metrics may only exist at a specific location, such as a host. The performance metrics can be viewed at each location simply by highlighting the entity (VM, host, or cluster) and clicking on Monitor > vSAN > Performance.

Figure 1. Viewing the performance service metrics at multiple locations in the stack
The metrics are typically broken up into a series of categories, or tabs at each level. Below is a summary of the tabs that can be found at each level.
VM Level
- VM: This tab presents metrics for the frontend VM traffic (I/Os to and from the VM) for all VMs living on the selected host.
- Virtual Disk: This presents metrics for the VM, broken down by the individual VMDK, and especially helpful for VMs with multiple VMDKs.
Host Level
- VM: This tab presents metrics for the frontend VM traffic (I/Os to and from the VM) for all VMs living on the selected host.
- Backend: This tab presents metrics for all backend traffic, as a result of replica traffic, and resynchronization data.
- Disks: This tab presents performance metrics for the selected disk group, or the individual devices that comprise the disk group(s) on a host.
- Physical Adapters: This tab presents metrics for the physical uplink for the selected host.
- Host Network: This tab presents metrics for the specific or aggregate VMkernel ports used on a host
- iSCSI: This tab presents metrics for objects containing data served up by the vSAN iSCSI service
Cluster Level
- VM: This tab presents metrics for the frontend VM traffic (I/Os to and from the VM) for all VMs living on the selected host.
- Backend: This tab presents metrics for all backend traffic, as a result of replica traffic, and resynchronization data.
- iSCSI: This tab presents metrics for objects containing data served up by the vSAN iSCSI service
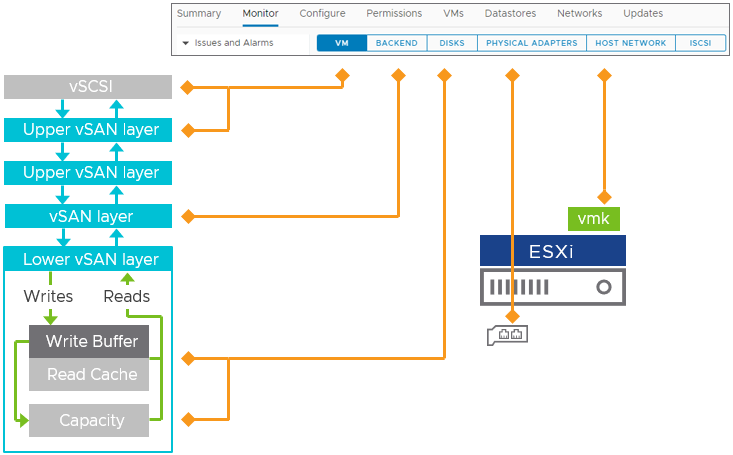
Typically, the cluster level is an aggregate of a limited set of metrics, and the VM level is a subset of metrics that pertain to only the selected VM. The host level is the location at which there will be the most metrics, especially as it pertains to the troubleshooting process. A visual mapping of each category can be found in Figure 2, below.

Figure 2. Mapping each category of the vSAN performance metrics at the host level to the layers of the storage stack
Note that the performance service can only aggregate performance data up to the cluster level. It will not be able to provide aggregate statistics from multiple vSAN clusters. VMware Aria Operations can achieve that result.
Which are the most important? I answer this question in the blog post: “Performance Troubleshooting – Which vSAN Performance Metrics Should be Looked at First?”
Recommendation: If you have the need for longer periods of storage performance retention, use VMware Aria Operations. The performance data collected by the performance service does not persist after the service has been turned off, then turned back on. VMware Aria Operations fetches the performance data directly from the vSAN performance service, so the data will be consistent, yet remain intact in the event that the performance service needs to be disabled, and reenabled
Summary
The vSAN Performance Service is an extremely powerful feature that in an HCI architecture, takes the place of storage array metrics typically found on a storage array in a three-tier architecture. Since vSAN is integrated directly into the hypervisor, the performance service is able to offer metrics at multiple levels in the stack and can provide outstanding levels of visibility for troubleshooting and further analysis. For more information, see the Troubleshooting vSAN Performance document.
Discover more from VMware Cloud Foundation (VCF) Blog
Subscribe to get the latest posts sent to your email.


