VMware vCenter has always been a treasure of information for the virtualization administrator. For many, it was their first experience with quality performance data: measuring and rendering consistently across diverse systems so long as they were virtualized. The quality of the data gathered in vCenter is the reason why other tools such as VMware Aria Operations uses data from vCenter for its Infrastructure analytics capabilities. The methods of measurement used by vCenter provided consistency across guest operating systems that were not previously possible.
While the venerable ESXTOP could be considered the premier tool for understanding deep levels of resource utilization in the hypervisor, the easy accessibility of time-based metrics in the vCenter UI typically makes it the first place to go when monitoring and troubleshooting performance of VMs running in vSphere and vSAN powered environments.
The metrics are there, but now what? It is waiting to be interpreted, but many are left with uncertainty on how to do so. I’ve described various techniques in the “Troubleshooting vSAN Performance” document on StorageHub, but let’s review one specific method in this post: Manipulation of time windows with performance metrics.
Manipulating time windows with performance metrics is one of the most helpful ways to improve the ability to assess and troubleshoot an environment. Time-based metrics help provide context. Context helps one understand if some measurement is normal for the environment, something that occurs occasionally, or is a true anomaly. It is the behavior over the course of time that provides real insight to the demands of the infrastructure, and the workloads the run on it.
Changing Time Windows
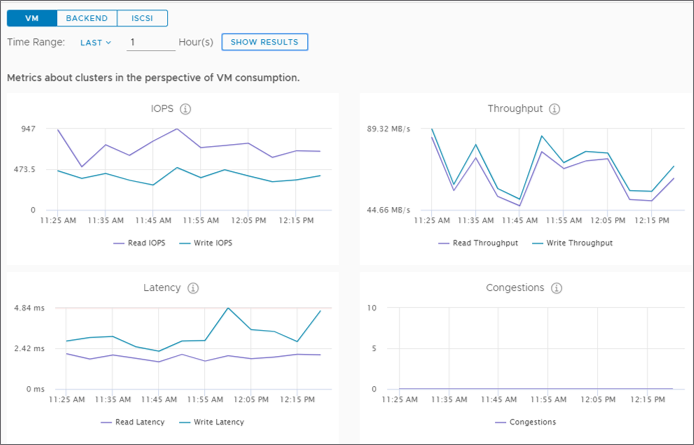
Let’s look at a simple example. In Figure 1, we see the default one-hour view for the vSAN performance metrics for a vSAN cluster. We can see that it tells us the IOPS, throughput, and latency for the past hour, but it doesn’t describe anything outside of this one-hour period. The time window is too narrow to help us understand if this is normal for the cluster.

Figure 1. vSAN cluster metrics using a one-hour time window
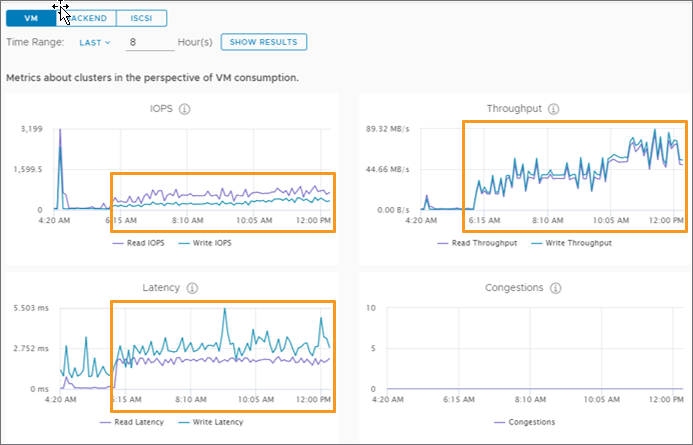
Now let’s adjust it back to an 8-hour time window. As Figure 2 shows, an 8-hour window captures activity prior to the start of the business day, giving us an understanding of the demand, and the abilities of the cluster throughout the day. The graphs clearly show the workloads in the cluster started in the morning time with IOPS and latency staying steady through the day. We see that throughput increased significantly after 10:00am, which is an indicator that new or changing workloads were introduced that were using larger I/O sizes. The steadiness in latency tells us that across the cluster, the increase of throughput from larger I/O sizes had very little impact on the capability of the cluster to provide the data at the same level as with less activity.

Figure 2. vSAN cluster metrics using an 8-hour time window
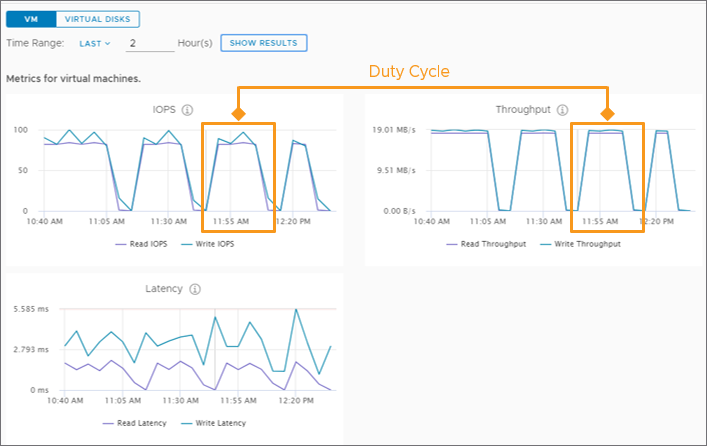
Aggregate data representing cluster level activity can play a critical role in the troubleshooting process across a shared infrastructure, but ultimately, when providing services to the consumers of the infrastructure, it is the VM performance that matters most. Figure 3 looks at the performance of a VM, but instead of a one-hour period, backs out to a two-hour period. Here we can see a pattern of demand develop for the VM. The pattern here is representative of a series of tasks that are repeated over the course of a given period and referred to as a “duty cycle.” While it may not always as obvious as it is illustrated in Figure 3, many production workloads will behave in this way.

Figure 3. vSAN VM metrics using a two-hour time window
As illustrated in Figure 4, backing out to an 8-hour window allows us to see that this specific workload begins around 6:00am and provides a good understanding of how much storage latency the guest VM is experiencing. The reasons for the latency can be many, and the process for helping to determine this can be found in the Troubleshooting vSAN Performance document.

Figure 4. vSAN VM metrics using an 8-hour time window
This helps us understand the typical behavior for the VM, and what type of performance the infrastructure is capable of delivering, in the form of latency as seen by the guest VM. It is with this information that we begin to build a good point of reference should performance issues arise, or efforts to improve performance through faster hardware.
The Caveat
Unfortunately, it is not as easy as simply increasing and decreasing the viewable window of time. To understand why this is the case, let’s review a common practice to data collection and rendering.
Systems like vCenter will sample performance data over a time interval, meaning that it counts the sum of say, read and writes over a given period, then averages it to represent the IOPS for that period of time. Shorter intervals can provide a more precise rendering of behavior, at the cost of consuming far more resources to collect, store and render the data. To provide a way to keep data for a longer period, vCenter will eventually “resample” or “roll up” the interval to a longer interval as the data ages. This can have an adverse effect on how results are perceived. Let’s look at a simple example. In Figure 5, we show the vCPU usage for a VM peaking at around 50% when the data is sampled every 20 seconds for the first hour.

Figure 5. VM vCPU metrics using a one-hour time window
Now let’s look at the vCPU usage of the same VM over the course of 24 hours. Figure 6 shows that it peaks at around 20%. This is due to the re-averaging that occurs across a larger sample size (5 minutes) where, for this workload, it incorporates a proportionally larger period of little to no CPU usage.

Figure 6. VM vCPU metrics using a 24-hour time window
Both are technically accurate for the method of measurement they are using, and depending on the conditions, may or may not be as extreme as illustrated here, but you can see here how sampling rate can impact perceptions of resource usage.
For vSAN specific performance data found in vCenter, this data is provided to us courtesy of the vSAN Performance Service. It is rendered in vCenter, but collected and maintained by the performance service, and stored as an object across the vSAN datastore. It handles data a bit differently than vCenter in that its sampling interval is initially lower – 5 minutes compared to 20 seconds. Data collected by the vSAN performance service is not rolled up like other vCenter based metrics, and may be retained for as long as 90 days, although that is not guaranteed. The display window of time is limited to a maximum time of 24 hours.
Recommendation: If you’re performing some real-time troubleshooting, and worried about higher sampling rate data in vCenter expiring, collecting relevant data in ESXTOP using batch mode is another option available. Just as with any ongoing data collection method using high sampling rates, care should be taken prior to using this approach so that the amount of data collected does not become overwhelming, or difficult to dissect.
Apply to VMware Aria Operations
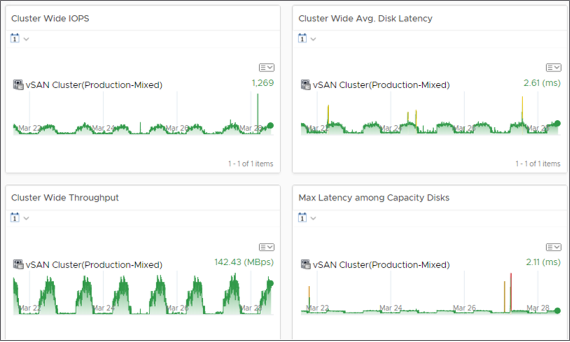
Manipulating time windows can and should be used in tools such as VMware Aria Operations. In fact, the collection and rollup intervals paired with the default retention periods make vR Ops much more suitable for evaluating patterns of data over a longer period. It can be a very good way to identify duty cycles of individual workloads, cyclical demands of the cluster, or recent changes. Figure 7 shows Cluster-wide stats over the time window of 7 days. This is a great way to learn about the patterns of individual VMs and clusters, and how the demand of those VMs may evolve over time.

Figure 7. vSAN Cluster view in vR Ops using a 7-day time window
Summary
Interacting with various time windows will help you not only determine what is normal, but identify when and potentially why behaviors are occurring at a certain point in time in your environment. For more information on this topic, as well as understanding and troubleshooting performance in vSAN, see the recently released white paper, Troubleshooting vSAN Performance.
Discover more from VMware Cloud Foundation (VCF) Blog
Subscribe to get the latest posts sent to your email.


