With the explosion of use cases in Generative AI, along with existing AI and ML workloads, everyone wants more GPUs and to maximize their usage of the ones they have. Today, GPU usage metrics are available only at the host level in vSphere, and with this Fling you can now see them at the Cluster level. This information is crucial to activities like capacity planning, which carry a significant strategic impact on organizations wanting to increase their usage of AI.
The vSphere GPU Monitoring Fling is bringing GPU metrics to the cluster level in VMware vSphere to make getting the most out of that expensive hardware easier. It is compatible with vSphere 7 and 8. This visibility is also available as a core vCenter 8.0u2 patch for those on newer versions (no Fling needed!). Download the plugin here and tell us what you think in the Threads section of the community.broadcom.com portal, or email [email protected].
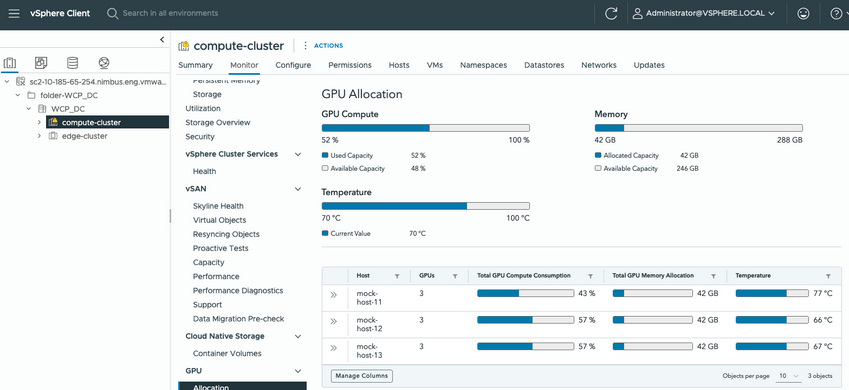
Users will be guided to install the plugin in a Datacenter and will be able to see summary metrics of their GPUs for clusters in that Datacenter that contain them. In the Datacenter view, a user can click on ‘View Details’ to see more detailed information on GPU Allocation and Consumption, as well as the type of sharing a GPU is using:
Finally, Temperature is also an important metric to track, as GPU longevity and performance are significantly degraded if GPUs are too hot for too long. This Fling incorporates temperature monitoring as well:


 Import Tool")