VMware vSphere 7 has been extremely popular since its release, bringing many new enhancements and features to virtual infrastructure (we’ve highlighted many of the updates on this blog!). There are some enhancements to the vSphere APIs, Code Capture, and the vSphere Developer Center features that make those easy-to-use tools even more powerful for people interested in automating their environments. I’d like to shine a light on all three of them in this post.
Let’s start with Developer Center, a single point of entry for developers and vSphere Admins that provides tools to manage and test APIs as well as capturing vSphere Client actions into usable code snippets. While in the vSphere Client the Developer Center shows off API Explorer & Code Capture as it did in vSphere 6.7, but with a few enhancements. The first thing noticeable is an updated Overview page describing Developer Center in more detail than in past vSphere versions and also highlighting its capabilities.

API Explorer
API Explorer was introduced in vSphere 6.5 and allows customers to browse and invoke vSphere REST APIs and provides information about the API endpoints. Accessing API Explorer has changed since its inception. In the past, it was recommended to browse to https://<vCenter-Server-FQDN>/apiexplorer (this method is still valid in vSphere 6.5, 6.7, and 7.0) login with the vSphere SSO Domain administrator credentials, then browse and use the APIs of a selected endpoint. In vSphere 6.7, API Explorer was moved to the Developer Center which allowed for APIs to be executed directly from within the vSphere Client versus using the older method of vSphere 6.5.
It’s also important to note that the available API endpoints in vSphere 6.7 are:
- vAPI: calls for vSphere APIs
- vCenter: calls regarding vCenter Server (Datastore/Cluster/VM settings/VCHA/etc)
- Content: calls for Content Library
- Appliance: calls for the VMware appliance (VCSA access/health/backup/etc)
- CIS (Common Infrastructure Services): calls pertaining to tagging (tag creation/categories/association/etc)

In vSphere 7, API Explorer did not change much in functionality but it did add a few new API endpoints that were not available in vSphere 6.7. The API endpoints from previous versions (vAPI, vCenter, Content, Appliance, and CIS) are included in vSphere 7 along with two new endpoints:
- ESX: calls regarding host operations (vSphere Lifecycle Manager/HCL/Host Settings/etc)
- Stats: calls regarding vStats (WARNING!! These APIs are in Technology Preview and may not work in all environments)

With API Explorer open, you can choose an API endpoint from your environment and execute the REST API. Details of the parameters, expected responses, and response status codes, exposed against the live environment. The APIs available will always depend on the role of the selected endpoint. In this example below, we can run a GET on the VM endpoint to show virtual machines in the environment.

When executed with API Explorer we can get a JSON file export of the data that will look similar to this. In the first image, we have the JSON export view of the VMs in this lab.

In the second image, we can see the vSphere Client view of VMs for comparison.

Code Capture
Code Capture or known sometimes still known as Onyx records user actions and is able to translate them into executable code. What started out as part of the vSphere HTML5 Web Client Fling, is now baked into the vSphere Client and has been since vSphere 6.7.
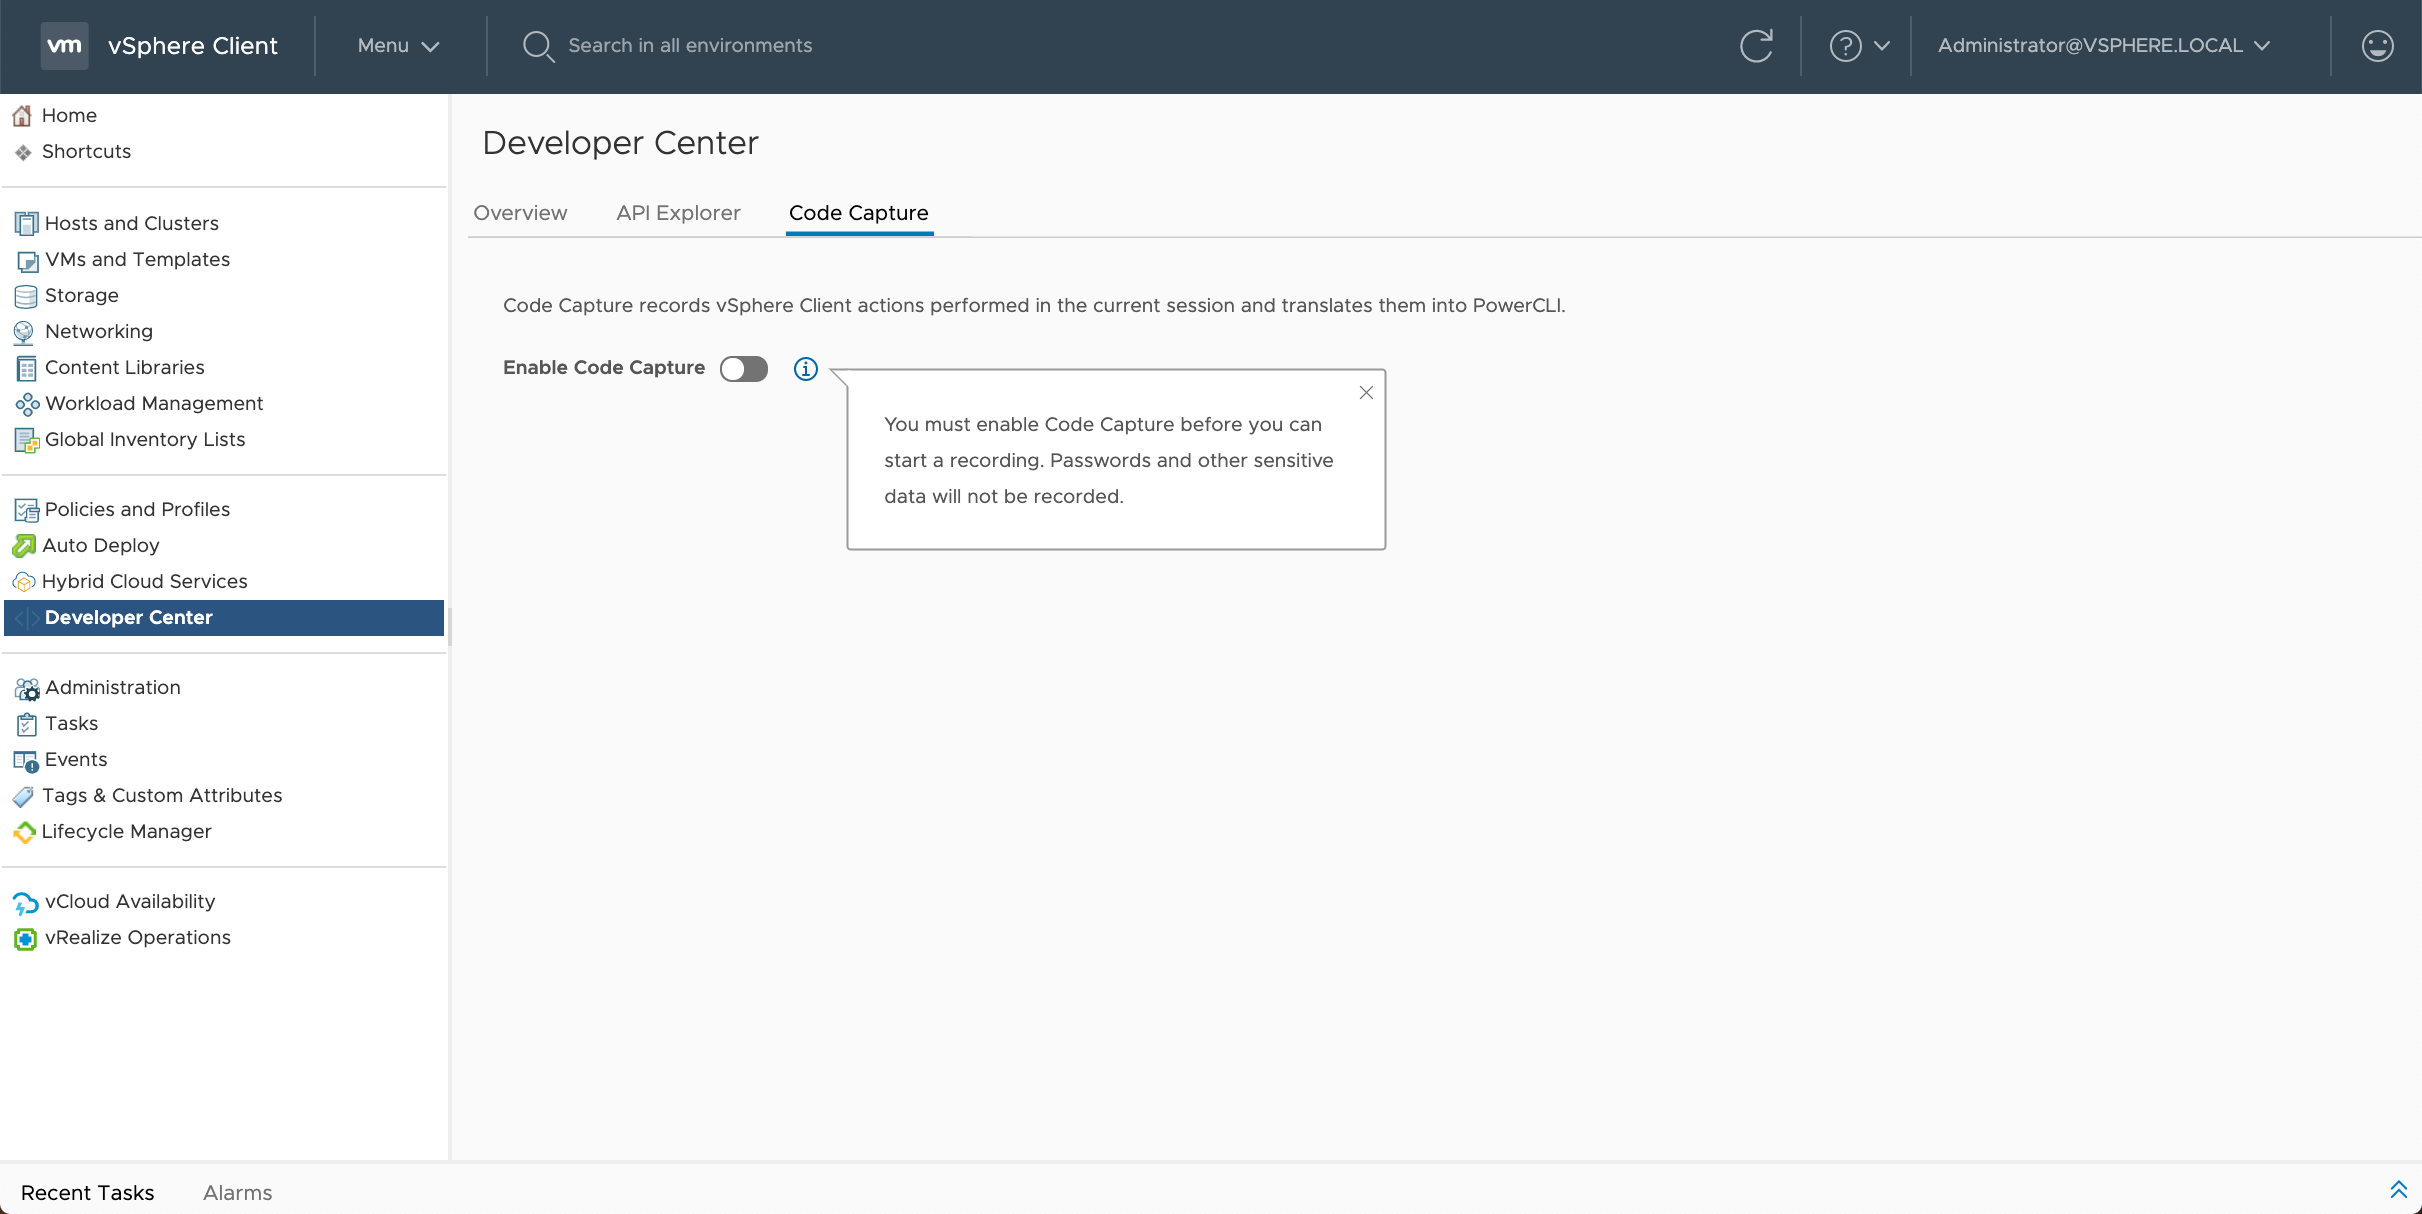
To begin using Code Capture it must first be enabled in the vSphere Client. After navigating to the Developer Center clicking on the Code Capture tab will bring up the below screen where the feature can be turned on.
Enabling Code Capture opens up the interface to begin recording your actions in the vSphere Client.
Select a starting output language from the following new choices in vSphere 7:
- PowerCLI
- vRO Javascript
- Python
- Go
Click Start Recording to begin.

We can now see that Code Capture is on and recording our actions in the vSphere Client and will output as PowerCLI when complete.

When done recording the desired actions, click Stop Recording or the red button in the top right of the vSphere Client to complete the “capture” of usable code. One of the great things added in vSphere 7 for Code Capture was the output of more than just PowerCLI code. When the output is displayed we can now toggle between the 4 available code types. This animation shows what this may look like. Pretty awesome in my book!

Wrap Up
vSphere 7 is full is many new features and enhancements, API Explorer and Code Capture are just two components with some great capabilities. To learn more about what’s new in vSphere, please visit our vSphere 7 page on our blog.
For more information on Developer Center, API Explorer, and Code Capture please visit these resources:
- Working with the Developer Center
- Using the API Explorer
- Using Code Capture
- VMware API Explorer (VMware Code)
We are excited about vSphere 7 and what it means for our customers and the future. Watch the vSphere 7 Launch Event replay, an event designed for vSphere Admins, hosted by theCUBE. We will continue posting new technical and product information about vSphere 7 and vSphere with Kubernetes Monday through Thursdays into May 2020. Join us by following the blog directly using the RSS feed, on Facebook, and on Twitter. Thank you, and stay safe!
Discover more from VMware Cloud Foundation (VCF) Blog
Subscribe to get the latest posts sent to your email.


