It’s easy to set up a cluster capacity dashboard in just one click and I’ll show you how to do it with vCenter Operations Manager Custom Dashboards. In this two-part blog series, I’ll guide you through steps to get this dashboard installed in your environment and explain how to create the interaction XML.
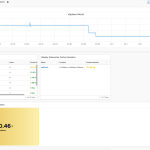
Let’s take a look at the final dashboard in the screenshot below, the problems it will solve, and its features. Then we’ll take a closer look at the process of designing this dashboard and the related customizations you can do.

Here is a quick summary and the features of this dashboard:
- The list of clusters in the environment being monitored in your Virtual Infrastructure (left pane).
- Once you select a given cluster, you will see the Capacity Overview of the cluster (right scoreboard widget).
- The scoreboard gives you the summary of the cluster, consolidation ratios, capacity remaining, waste, and stress data.
- Each score’s color designates VMware configuration maximums. (For example, if the number of hosts comes out to 33, the box will turn red as vSphere 5.x currently supports a 32-node ESXi Cluster. You have the option to define these thresholds while creating the XML—I’ll share this in a moment.)
- This dashboard can help CXOs get details about the capacity of each cluster with just a click of a button. It can also easily help them make procurement decisions.
- Using this dashboard helps IT teams quickly decide which clusters can be used for any new Virtual Machine demand from the business, etc.
- Finally, large service providers can use this dashboard to keep tabs on the resource utilization and available capacity.
Download Files
The beauty behind this customization is that I can export this dashboard right from my vCOps instance and import it into any vCOps instance with a few steps–and it will work like a charm. You can successfully reuse this dashboard in your vCOps instance, if you have the vCOps advance or Enterprise edition, which includes a custom UI.
Download the Cluster-XML.xml file below to see all of the metrics to display in the scorecard on the right as soon as a cluster is selected on the left pane. In part two of this series, I will tell you how to write this file. The Cluster-Capacity Dashboard.xml file is just a simple export of the dashboard from the Custom UI.
You can do the same for any dashboard that does not have any dependencies for resource IDs (unique identity number given by vCOps to each of its inventory object). You would take a two-step approach to use these files to achieve the final result.
Files to download:
Cluster-Capacity Dashboard.xml
Step-by-Step Instructions to Place the Cluster-XML.xml in a Specific Location of UI VM
- Use an SCP software to login to the UI VM using the root credentials. I am using WinSCP.
Change the directory to the following location: /usr/lib/vmware-vcops/tomcat-enterprise/webapps/vcops-custom/WEB-INF/classes/resources/reskndmetrics - Drag and drop the Cluster-XML.xml file from your system where you downloaded it to this directory as shown in the screenshot below.

- Right click the target file, and then click on Properties to change the permission level to 644 (for read and execute rights) as shown below.

Now that you’ve finished the first set of steps, let’s go through the second set of instructions.
Step-by-Step Instructions: Import Cluster-Capacity Dashboard.xml Dashboard in vCOps Custom UI
- Log into vCOps Custom UI using an ID with administrative privileges.
- Click the Import Option under the Dashboard Tools menu.

- Browse to the location where you saved the Cluster-Capacity Dashboard.xml and click Import.

- You’ll now see a dialog box indicating that your dashboard was successfully imported. Close the window and click the Dashboards Menu to find a new dashboard named “CLUSTER-WISE CAPACITY OVERVIEW”

- Click this and you will now have see the dashboard I displayed at beginning of this post. It’s that simple! :-)After importing the dashboard, if you do not see the names of your cluster in the Resources Widget, you must edit the “Resources” Widget -> Select “Cluster Compute Resource” in the left pane and click OK. This will list all your clusters.
Stay tuned for part two of this article where I’ll provide steps to help create your own .XML files to build additional dashboards. This is useful for those who want a single pane to view the entire capacity of a Virtual Infrastructure.
Additional Notes and Resources
Please send us your feedback and comments about this #TechTip below, as well as requests for #TechTips on other topics. And yes, follow us on twitter @vcenterops to get the latest on vCenter Operations and Cloud Operations Management topics. For a full list of all blog posts in the vCenter Operations Management Tech Tips series, search for posts with the tag ‘tech tips‘, or just visit http://blogs.vmware.com/management/tag/tech-tips.


