vRealize Operations Manager is a capable monitoring solution that plays a key role in VMware’s cloud management stack. It has the potential to give visibility in to the past, present and in some cases the future. The key to unlocking this potential is in making the product operational and integrating it with an organization’s daily routine. One of the most effective ways to do this is by generating meaningful alerts that can be trusted and acted upon. This article will review some alert tuning guidelines that a vRealize Operations Manager administrator can follow to begin the process of alert tuning.
Day One
When vRealize Operations Manager is first deployed, the installed management packs and solutions come with a variety out-of-the-box content. This content may include things like dashboards, views, reports, symptoms and alert definitions. Both VMware and trusted partners create this content to emphasize best practices and create a more comprehensive experience when analyzing data from data sources. While typically useful, there are situations where out-of-the-box content, such as symptoms and alert definitions, may need to be adjusted. There are many reasons why an organization may not want default alert configurations, but the most common reasons are:
1. High volume of non-actionable alerts
2. Alert thresholds are undesirable or too aggressive
3. Default alerts may not address all customer requirements
In the field, one of the most common first impressions from users is that there are far too many active alerts to be actionable. More often than not, this is due to incorrectly tuned alerts that activate in high volume. And so, reducing the volume of “noisy” alerts in favor of fewer and actionable alerts should be one of the primary objectives in tuning alert definitions.
Take Stock
Before making adjustments to symptoms or alert definitions, I always recommend taking inventory of active alerts in the environment. To do this, one must determine the %-distribution of alerts and which alerts are generating the most volume. To determine the %-distribution of active alerts based on alert definition, create and leverage the following View, to be run on the “Universe” object.

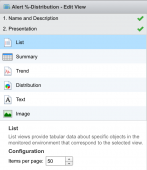

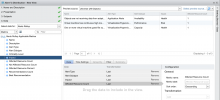

Approach
Once alert definitions have been singled out as excessive or possibly inaccurate, they must be reviewed in more detail. Samples of active alerts for each alert definition should be opened to identify symptoms that are responsible for triggering the alerts. Further, alert definitions themselves should be reviewed to ensure the rulesets and criteria are appropriate.
When tuning alerts, I recommend the following guidelines:
- Adjust notification rules before modifying symptoms or alert definitions. Oftentimes, teams begin dismissing alerts when they are flooded with notifications. This is easily prevented by filtering and scoping alerts using notification rule filters. The easiest way to start with notifications is by “keeping it simple” and focusing on the most critical and actionable alerts. I suggest starting with a filter for “Health” impact and “Availability” sub alert types.
- Avoid deleting alert definitions that are out-of-the-box. Alerts aren’t solely meant to “notify” users of problems, rather they also influence object Health, Risk and Efficiency scores. Always try to correct the underlying cause of an alert definition’s inaccuracy before dismissing it, even then doing so by disabling rather than deleting it.
- Avoid deleting symptoms. These “breadcrumbs” may be used for multiple alert definitions and should be modified instead of deleted.
- Address alert definition inaccuracies in the following order:
- Adjust symptoms.
- Adjust alert definitions, modifying conditions or symptoms to better meet the needs of the organization.
- If all else fails, disable the alert definition in the specific policy for the group of object for which it is inaccurate. If the alert definition is not desired for the entire environment, only then disable it in the default policy or consider it for deletion.
Tuning
Once the general guidelines above are understood and it is warranted to modify symptoms, consider the following approaches to each type of symptom you may encounter:
- For symptoms based on static thresholds, those threshold values may need to be changed at the symptom content level or via policy symptom overrides.
- Oftentimes these static thresholds are based on industry or vendor best practices, however they can be adjusted if an organization has established thresholds that would be a more appropriate.
- Ben Todd has a post here that has an example of this change.
- For symptoms based on dynamic thresholds, those symptoms and associated alert definition criteria may need to be disabled until metric dynamic thresholds become more established and consistent.
- Some management packs leverage symptoms based on dynamic thresholds given the absence of an established “best practice” that would be true for all situations. If data proves to be inconsistent or irregular, these symptoms may need to be modified or possibly deleted due to a lack of value.
- For symptoms based on Faults or Message Events, be mindful that these symptoms activate on collected events rather than evaluated conditions. These symptoms typically cannot be negated, or deactivated, automatically. This is a widely understood caveat to alerting based events versus conditions, however sometimes this is the only means available to capture information of value.
- For symptoms based on policy Analysis Settings and other derived values, policies may need to be adjusted.
- These symptoms can be adjusted indirectly by configuring Analysis Settings in policies. An example of this would be symptoms that consider “projected” capacity or “time remaining” deficits.
Create
When existing symptoms and alert definitions fall short, it may be necessary to get creative and build your own. Some examples of such a task can be found in product documentation as well as in other Cloud Management blog posts. Typical use cases for creating new symptoms and alert definitions are:
- Organizations that have additional best practices and criteria that need to be evaluated.
- Alerts that roll-up symptoms to organizational constructs, such as Custom Groups, that act as upstream points of alerting.
- It can be beneficial to evaluate symptoms and activate alerts at an upstream point in a hierarchy versus on individual descendant objects. This upstream alert definition rolls up symptoms of descendant objects to a single alert.
- A common scenario is when a Custom Group contains multiple Virtual Machines belonging to a specific application. Singular alerts activate on the Custom Group indicating which Virtual Machines have the symptom(s), versus multiple individual alerts activating on each Virtual Machine.
- SLAs can be tracked by using roll-up style alerts. Multiple descendant objects may be evaluated, often by count or % of the population, reflecting the overall state of the object population.
- An example of this would be a Custom Group containing a pool of web servers. An SLA could be reflected by rolling up the web service availability and generating an alert if less than 75% of the web services are available.
Observe and Refine
Once symptoms and alert definitions have been tuned, the environment should be observed over the hours and days that follow to determine if more tuning is necessary. It should be expected that iterative changes will be made over time, but initial tuning as reviewed in this article can quickly increase the effectiveness of the solution and move it closer to being operationalized. Using this mindset and methodology, you too can ensure the tool’s value is fully vRealize’d for your organization.


