(Editor’s note: We now call this vRealize Operations).
In my last article in this series, Adding your License to vCenter Operations Manager, I walked you through the difference between VMware’s vCenter Operations Manager Foundation and more advanced, standard edition. I also showed you how, step by step, to install your vC Ops license key and assign it to the vC Ops solution.
In this article, we’ll cover one of the most important things that you need to know to use vC Ops, on a daily basis. Specifically, we’ll cover what vC Ops Badges are and how they can help you to, very quickly, identify issues in your virtual infrastructure (or be able to glance at the screen and know that “everything is great”).
vCenter Operations Manager – Major Badges – Health, Risk, and Efficiency
One of the features that makes vC Ops unique is its badge identifier system. If you “know your badges”, you can quickly identify good or bad conditions in your vSphere virtual infrastructure, just with a quick glance at the badge shape, color, and number. Badges will be green, yellow, or red (and you hope that your badges are green, as green is good). Badges will also have a numerical score on them. Depending on the badge, a lower number may be desirable over a high number, or vice versa.
vC Ops has 3 major badges and their status depends on the minor badges whose scores get rolled up to make up the major badges. Those 3 major badges are Health, Risk, and Efficiency. Each of these 3 badges are weighted combinations of minor badges. Thus, the major badges are the color and numerical score that they are because of the status of the minor badges that they are summarizing.
Let’s look at them one at a time.
vCenter Operations Health Badge
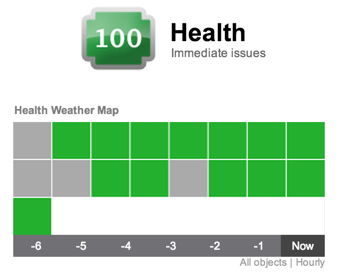
The vC Ops Health badge tells you how “healthy” your vSphere infrastructure is (if you are at the World level of the inventory) or it tells you how healthy a particular object is such as a virtual data center, host, VM, or cluster.
The health badge is a weighted combination of Workload, Anomalies and Faults badges.
The higher your health score, the better off you are. Thus, a “100” is perfect health.
vCenter Operations Health Minor Badges – Workload, Anomalies, and Faults
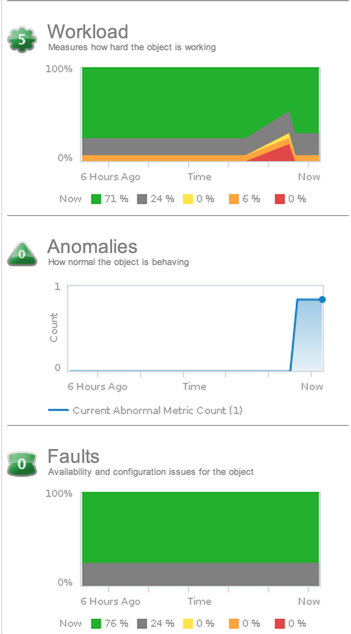
The Health badge summarizes workload, anomalies, and faults.
The Workload badge shows how hard an object is working. A higher workload score indicates that an object is doing more work. Obviously, you don’t want objects out there doing zero work, as that is waste but, as the same time, you also don’t want objects completely maxed out with a workload score of 100 either. Workload is an absolute measurement that calculates the demand for a resource divided by the capacity of an object. Resources might include CPU, memory, disk I/O, or network I/O. vC Ops will help you to balance workload across your resource objects effectively.
The Anomalies badge indicates how the object is behaving currently compared to how it has behaved in the past. While small anomalies don’t always indicate something bad, large anomalies are likely an indicator of a problem. vC Ops uses anomalies to determine what is “normal” in the your vSphere infrastructure vs what is “abnormal”.
The Faults badge tells you if configuration issues have occurred for an object. Faults are given priority over anomalies and workload when calculating health. Faults are calculated based on the events received from VMware vCenter about an object. Examples of events that might generate faults are ESXi host memory errors, loss of network or HBA redundancy, a failover event in a HA cluster, or hardware events (like high CPU temperature) received from CIM events.
vCenter Operations Risk Badge
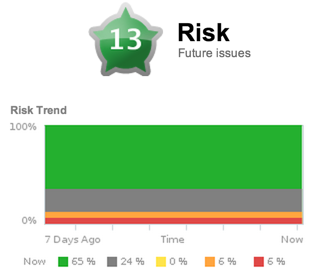
The second major metric that vC Ops report is Risk. Risk is a combination of its three sub-metrics – Stress, Time Remaining and Capacity Remaining. You can think of Risk as a rating of how “risky” the virtual infrastructure is in terms of it’s performance or capacity. I compare the Risk score of vC Ops to a credit score of an individual or company – which reports how “risky” that object is to lend money to or to invest in. The difference is that, with those scores, a lower number is a bad indicator where, with Risk in vC Ops, a higher number is a bad indicator.
You don’t want to run a “risky” virtual infrastructure do you? Nor do you want to have a VM or datastore be “risky” as it may be unreliable in the future.
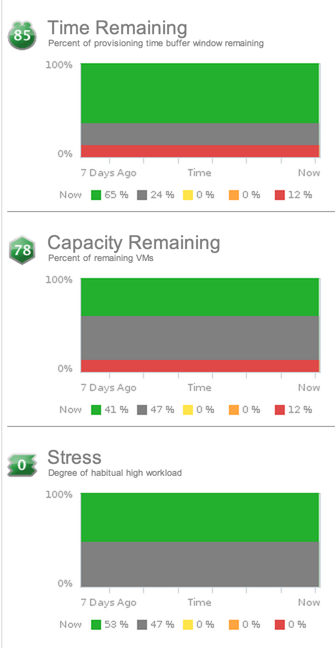
vCenter Operations Risk Minor Badges – Time Remaining, Capacity Remaining, and Stress
You can think of the risk of something like your own personal health risk. How much stress are you under? How much free daily time/capacity do you have to take care of anything unexpected that might come up and (I hate to be morbid but) how much “time remaining” do you have on this earth, because of any potential bad habits (smoking, drugs, drinking, not exercising, eating poorly)? You can think of your vSphere virtual infrastructure in the same way.
Let’s look at the 3 sub-badges that make up Risk, one at a time.
With Time Remaining, you will be able to see the amount of time left before the object you are analyzing reaches its maximum capacity. The amount of time remaining takes into account the provisioning or load balancing buffer that you can specify the vC Ops configuration.
For example, let’s say that you specify that you want 7 days buffer time to provision additional storage capacity. The vC Ops time remaining badge will report 10 if you have 17 days of capacity left (17-7-10) or zero even if the datastore has 6 days of capacity remaining. If you look at a similar example with a ESXi host, where disk I/O, network I/O, memory, and CPU are all taken into account, if even one of those resources has 7 days of resource time remaining (or less), then the total time remaining score for the server is still 0.
The Capacity Remaining badge score indicated the number of remaining virtual machines you can fit in that object. For example, on a datastore the capacity remaining is pretty straightforward — how much capacity is remaining to hold VMs? However, on a host, it’s a bit more complex because the host has CPU, memory, disk space, and other aspects to contend with. If the host only has capacity to hold 1 more VM because it is low on memory, but it could hold 20 more VMs in terms of CPU and disk, then the capacity remaining will be just 1 VM (the lowest number is the capacity remaining).
The VM that is used to make these estimations is based on the current amount of unused resources and the average virtual machine profile. The capacity remaining calculation uses the same resource statistics as the time remaining score but the capacity remaining is shown in VMs where the time remaining is shown in days.
Finally, the Stress badge reports the stress that an object is under. Just as your stress level is related to your workload, so is the stress score in vC Ops. The stress score is based on long-term high workload (where the workload score is instantaneous workload). Stress in the virtual infrastructure might come from VMs that are undersized, hosts that are overloaded, or datastores with consistently high I/O latency. Stress is reported between 0 and 100 with 100 being very high stress and 0 being no stress.
vCenter Operations Efficiency Badge
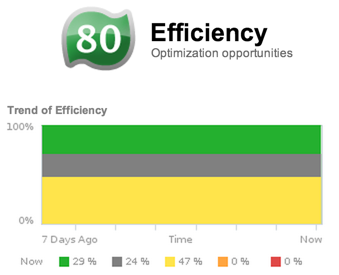
The third major badge that vC Ops reports is Efficiency. We all moved to virtualization in hopes of achieving greater efficiencies but there are varying degrees of efficiency so vC Ops is here to help ensure that you maximize the efficiency of your virtual infrastructure. The efficiency badge score is a weighted combination of Reclaimable Waste and Density.
You want your virtual infrastructure to be as efficient as possible, right? In that case, you want to push your efficiency score up toward 100, as much as is possible (unlike other scores where 100 might indicate trouble).
vCenter Operations Efficiency Minor Badges – Reclaimable Waste and Density

The Reclaimable Waste badge indicates what resources you can get back from your virtual infrastructure. Those reclaimed resources might allow you to provision more VMs (at no additional resource cost) and might even save you enough money (on not having to purchase additional hardware) so pay for your purchase of vCenter Operations Manager.
The other metric that makes up efficiency is density. The Density badge is measures your virtual infrastructure consolidation ratios to to ensure that you are maximizing your virtual infrastructure investment. According to the vC Ops Documentation:
“Density calculates the amount of resources that you can provision before contention or conflict for a resource occurs between objects. The ratios account for the number of virtual machines to host, the number of virtual CPUs to physical CPU, and the amount of virtual memory to physical memory.”
Quick Summary – What you Need to Know About Badges
To sum up all the badges and scoring we talked about in this post, here’s what you need to know:
- Know your badges to be a productive and efficient vSphere Admin
- All badges should be green, if not, find out why
- Health and Efficiency scores should be HIGH (as close to 100 as possible)
- Risk scores should be LOW (as close to 0 as possible)