Folks, I am excited to announce that the next release of vCenter Operations Management Suite, version 5.8, will be generally available later this year. This blog post will provide an overview of the top new capabilities that are coming with this latest release.
We are working to help IT organizations on their journey to the cloud, and the transition from a Builder of Services to a Broker of Services, and be able to manage multi-platform, multi-provider, hybrid cloud environments. (You can read more about this transition and how we enable it, in Ramin Sayar’s blog post – ‘VMworld Europe 2013: Cloud Management Launch‘). A core aspect of enabling this transition is to provide IT organizations with management tools that simplify and automate management, and help IT manage operational governance and control through analytics and policy automation.
This is where vCenter Operations Management Suite comes in. It is a highly automated and integrated analytics platform and operations console that provides visibility into the health of your infrastructure and applications across hybrid clouds and heterogeneous environments.
There are some key areas of focus in our approach to simplify and automate Operations Management. One area is Intelligent Operations; using patented analytics to provide better visibility into datacenter operations. And another is Unified Management; providing operations team with a unified view of what’s happening in their highly virtualized and cloud environments. With today’s announcement, we have made strides in both these key focus areas. The following graphic gives you a quick snapshot of what’s new.
Now let me provide more detail on these new capabilities.
Enhanced Monitoring of Microsoft Applications
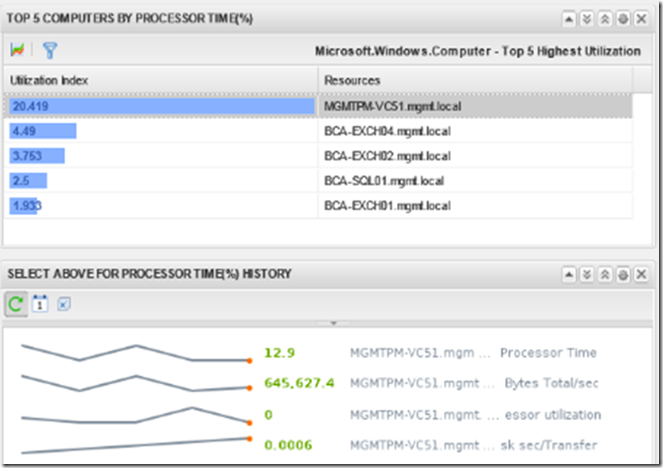
The vCenter Operations 5.8 release includes enhanced support for Microsoft SQL Server and Microsoft Exchange. You now have visibility into application health and it’s relationship to underlying infrastructure and application components, helping you reduce MTTI by providing a clear troubleshooting flow and easy view of problematic components that relate to the issue. It includes:
- Knowledge – based on research with SMEs on application specific deployment and common issues.
- Discovery – automatically discover application components, their inter-dependencies and the connection to their underlying infrastructure
- Policies – built-in Monitoring policies for common applications that include default metrics, collection intervals, thresholds and alerts.
- Dashboards – preconfigured and predefined application specific dashboards for visibility and troubleshooting.
- Application Visibility – application health according to clusters (MSCS & DAG), servers & instances.
- Services & Topology – display roles, relationships and relation to virtual infrastructure (VMware vSphere & Microsoft Hyper-V).
- KPIs – display key metrics related to the component.
- Alerts – built in alerts and thresholds
Here is an example of what a dashboard view for SQL Server could look like in vCenter Operations Manager.
New Storage Analytics Capabilities
vCenter Operations 5.8 provides basic visibility into the physical storage stack such as HBAs, Fabric and Arrays through three out-of-the-box storage dashboards. This helps the vSphere admin have “good-enough” data to troubleshoot storage issues that are affecting the virtual environment and effectively handoff to the storage admin. It brings together Topology, Stats and Events from FC enabled HBAs, Fabric and Arrays by leveraging standardized protocols such as CIM, SMI-S and VASA (no stats in VASA 1.0).
Here are some use case examples that are now enabled:
- Topology – the admin can look at the hierarchy across HBA > Fabric > Array by viewing the hotspots in the stack to find “why is my VM slow?”, and also show details on the topology such as the Fabric Name (e.g. Brocade zoning info), and Negotiated Link Speed.
- Stats – the admin can isolate resource starvation issues in the storage stack by viewing throughput and latency at HBA and Fabric, as well as IOPS and queue depth at the HBA and target port for both read and write operations.
- Faults – the admin can get alerted on availability issues, configuration changes & errors with visibility into CRC errors, link loss errors and sync loss errors in the path between HBA to the array, as well as faults such as flogi count, ABTS (aborts), I/O exchange timeout, LUN resets etc.
Support for Microsoft Hyper-V
vCenter Operations 5.8 includes support for Hyper-V Server & Windows Hyper-V, by leveraging vCenter Hyperic. Results are available in the Custom UI. Discovery of Hyper-V hosts & associated VMs is done through the Hyperic agent deployed in Hyper-V Host. In terms of Topology, the relationships are created in vCenter Operations as Hyper-V Host –> VM –> OS. Includes is monitoring of critical levels for CPU, Storage, Network and Memory.
The out-of-the-box dashboards for Hyper-V include –
- Cluster, Host, VM Utilization – top 25 by CPU, Memory, Disk IOPS, Network, etc.
- Datastore Capacity and Performance – Disk Space Used, Usage by VM, Latency, Commands per Second
- Load Heatmaps – CPU, Memory, Disk, Network
Note that Hyper-V information can be accessed by leveraging vCenter Hyperic, as well as through the vCenter Operations Management Pack for SCOM.
Support for Amazon Web Services (AWS)
vCenter Operations 5.8 brings support for AWS through the vCenter Operations Management Pack for AWS. The results are available in the custom UI. Data is pulled in from AWS Cloudwatch, leveraging the REST API exposed by AWS.
Multiple AWS services are supported, such as:
- Elastic Compute Cloud
- EC2 instances
- Elastic Block Store (EBS) volumes
- Elastic Map Reduce (EMR)
- Elastic Load Balancing (ELB)
- Auto Scaling Group (ASG) – automatic aggregation of instance metrics on groups.
Note that you can configure data pulls by service and only bring in the services you wish to monitor. All default metrics from Cloudwatch are pulled in. AWS alarms are pulled in as vCenter Operations hard threshold violations.
So that was an overview of some of the hot new capabilities coming in vCenter Operations Management Suite 5.8 later this year. In the meantime, you can –
- Follow @vCenterOps to get the latest on vCenter Operations, and join the conversation with the tag #vcops.
- Learn more about vCenter Operations on the website.
- Get a 60-day Free Trial of vCenter Operations at the Eval Center.
Thanks for reading!
Himanshu (@himanshuks)


