At VMworld Europe last October we announced three new suites for operations management, application management and IT business management. Together, these three management suites deliver on our vision to simplify and automate IT management in the cloud era. Check out this video of VMware CTO Steve Herrod introducing our new virtualization and cloud management portfolio on main stage at Copenhagen. Now that the vCenter Operations Management Suite is generally available, let’s take a closer look at some of the new capabilities.
Automated Operations Management
With vCenter Operations 5.0 we’ve greatly enhanced some of the concepts and analytics introduced in vCenter Operations earlier this year. The new suite improves on the existing functionality and delivers several new capabilities including:
- Operations Management dashboard with smart alerts in all editions
- Fully integrated performance, capacity and configuration management
- Application discovery and dependency mapping
- New editions targeted at SMB and enterprise customers.
If you’re used to managing vSphere performance with esxtop or the vSphere client, you might be asking, why you should look at vCenter Operations? The reality is that more and more monitoring data is collected in a virtual environment. For example, vSphere 5 introduces about 130 new performance metrics greatly expanding the breadth of the datacenter fabric (storage, network, etc.) that vSphere is managing. At the scale of several hundred VMs, you can quickly see that operations management is becoming a “big data” problem if you stay focused on individual metrics — what metrics should you look at, are there some metrics more important than others, what is the range of values and what thresholds should you set to alert about a performance problem, etc.?
In reality, not one or a few select metrics are more important than others. We need to look at managing the environment holistically and take advantage of the rich data and intelligence that the vSphere platform provides. This is why we introduced new “supermetrics” to better describe workload, health, risk and efficiency of individual VMs, hosts, clusters or entire datacenters. The key point here is that all metrics must be analyzed as performance is determined in context of CPU, memory, network and storage demands.
More importantly, we also need to measure how these metrics change over time and build up a knowledge base of learned behavior so we can determine whether the numbers we’re seeing right now are within an expected range or if they deviate above or below normal. This is what we call dynamic thresholds that adjust automatically with the behavior of the environment. Our intent is to completely eliminate the need for setting and managing static thresholds that either lead to false alarms or don’t fire when they should. Dynamic thresholds are proven to lead to fewer, but more actionable alerts.
There is a lot more to be said about the analytics in vCenter Operations than what I can cover in this post, but here is a brief summary of some of the new super metrics introduced in VC Ops 5:
- Health describes the current behavior of the environment and any problems that need to be addressed immediately. Health is composed of workload, anomalies and faults. Workload is a measure of how hard the VM is working relative to the resources it wants and what it is entitled to using. Anomalies is an expression of the number of metrics trending above or below normal which is a leading indicator of upcoming performance problems, and faults is the number of “hard” thresholds that have been crossed when there is an availability issue or a hardware failure has occurred.
- Risk describes the potential for future problems. Risk combines scores for time and capacity remaining before resources are exhausted. Risk also includes a new metric for stress which shows patterns of chronic strain. For example, during certain times of the week, there is more demand for resources in one cluster while other clusters are at or below capacity. You can use this information to optimize VM placement or to pre-allocated resources ahead of time.
- Efficiency is a new super metric to describe optimal utilization of resources. Efficiency includes scores of reclaimable waste, such as idle, over- and under-provisioned VMs, and VM density. VM density shows current consolidation ratio vs maximum possible ratio without performance degradation.
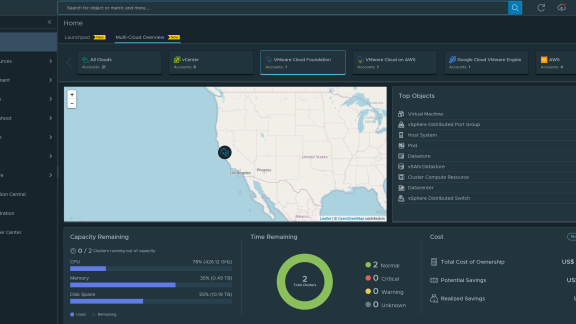
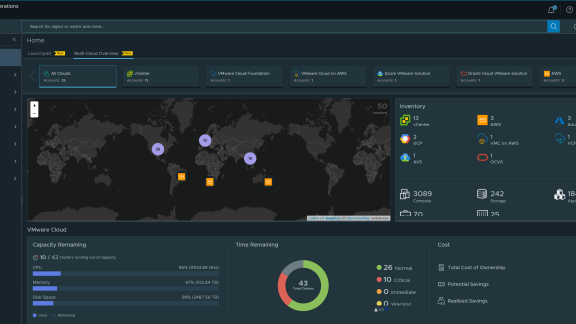
These super metrics are readily available in the operations management dashboard of the suite. Drill-downs allow you to quickly zoom into individual clusters or hosts or zoom out to get a datacenter-level view that might span multiple instances of vCenter Server. Moreover, we’ve added smart alerts with automated root cause analysis in all editions so you can proactively manage (and avoid) performance problems building in the environment.
Speaking of root cause analysis, we often hear from VI admins that 9 out of 10 performance problems are change related. In vCenter Operations 1.0 we already introduced the ability to correlate vSphere change events with performance and health metrics. In VC Ops 5 we introduce the ability to also show change events that occur inside the VM, such as registry changes, patches and applications that users may have been installed. This data is supplied by vCenter Configuration Manager (VCM) which a lot of organizations are already using for configuration and compliance management. Integrating configuration data with performance metrics give you a more holistic view of the environment which will help reduce finger pointing and improve relationships with storage engineers, and DBA’s.
To give you an idea of how this works in a real world scenario, I’ve included a video of vCenter Operations managing the hands-on labs (HOL) at VMworld 2011. The proactive alerts generated from vCenter Operations allowed our HOL team to detect and resolve a building storage problem before it started to impact lab attendees resulting in a flawless performance of what happened to become our biggest and most successful VMworld lab to date.
Better visibility into application components and services running on virtual infrastructure will help improve your ability to manage the environment. This is where vCenter Infrastructure Navigator (VIN) comes in which provides application-awareness for users of vCenter Operations. It discovers application components, automatically names them and provides version numbers and maps out visually where these components are running and how they’re communicating with one another. Use case for VIN include impact analysis, disaster recovery planning and datacenter and application migration projects. With VIN, you can easily find VMs and see visually how they communicate and relate to other VMs within the context of an application. Check out this video to see Infrastructure Navigator in action.
Overall, the vCenter Operations Management Suite has been very well received by our customers and the new 5.0 release is another big step forward in simplifying and automating operations management. Again, the new version is available now and you can download a 60-day free trial. Existing customers can upgrade to the new version free of charge. We’re very proud of what we’ve accomplished with this release but, of course, it’s what you think that’s important. So please send us your feedback and your questions.

