by: VMware Staff Applications Developer Ravi Muppidi and VMware Senior Business Systems Analyst Sharanu Sanklipur
Micro-SaaS approach
Micro-SaaS, by market definition, is focused on just one or a specific small set of challenges for a specific group. For example, micro-SaaS is actively used for catering to customer needs in the best way possible. VMware SaaS Dashboard™ is a tool built on the micro-SaaS concept. It acts as a UX and monitoring tool for all APIs, which support SaaS billing applications for VMware products.
The challenge
With all the major SaaS applications moving to microservices-based architecture, the productivity of the key players in a product lifecycle—business operations, technical product managers (TAM) or IT support—drops when troubleshooting transaction failures.
The business users must depend on IT support for the latest status of transactions. The product managers depend on technical team members to understand the general health of the API and product. Based on these challenges, VMware IT brainstormed the micro-SaaS approach to develop a framework where any API can be traced, by even nontechnical team members using automated UI.
Tool implementation
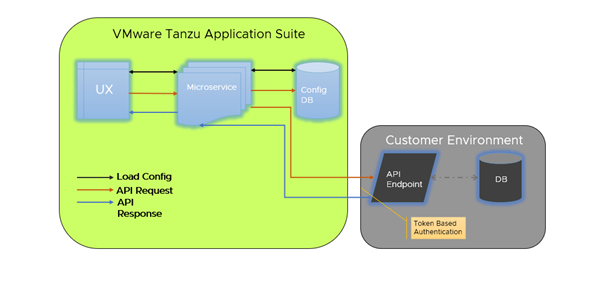
The SaaS dashboard tool is built using the open-source Angular JS and the VMware Spring™ frameworks. The UI is designed using Clarity Design System open-source standards. This whole application is hosted on VMware Tanzu® Application Service™.
The configurations of the tool are stored in a database—MariaDB and accessed via microservices. With easy-to-use configurations, it provides a separate UI for every new API onboarded. The API configurated on the tool can be internal or external VMware and is hosted on the customer environment.
How it works?
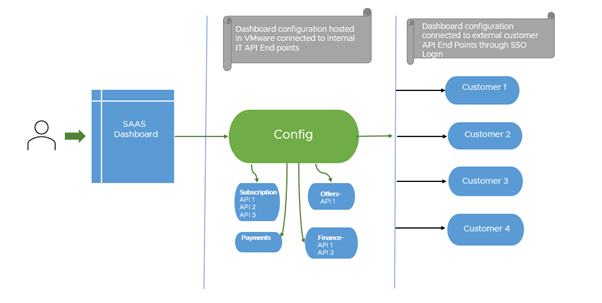
- Users will log in using single sign-on (SSO) credentials
- The external customer SSO can also be plugged in to the SaaS dashboard for authentication
- Admin user can configure API from config wizard by
- Using API specifications
- Manual configuration (API fields to UI fields mapping)
- Admin user can give permission to view the API
- Configured API can be viewed by the user with various filter and sort options, including export in MS Excel format.

Figure 1: End-user view of the VMware SaaS Dashboard tool.

Figure 2: Technical view of the SaaS Dashboard tool

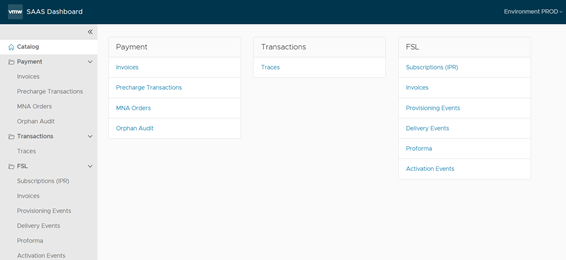
Figure 3: Dashboard landing page of the SaaS Dashboard tool.
Salient features
- Direct integration with GitLab—UX can be created dynamically for any API using API Spec, which is hosted on GitLab.
- No code-configurable UX—using default templates, users can configure UI components, which are mapped to an API Spec.
- Roles-based access—end user can log in via SSO; view is based on roles and permissions given to the user.
- Report export option—from the user login view, there is an option to create an Excel report for the specific API data.
- Scalability
- SaaS Dashboard tool is scalable to any number of APIs.
- Infrastructure (VMware Tanzu® Application Service™) is scalable horizontally and vertically for high performance and to support multiple customers.
SaaS dashboard tool users
The tool is designed for specific audiences but can be extended to the other stakeholders working onthe product based on API access.
- Technical product managers
Technical product managers identify business and the need for creating APIs and also orchestrate the planning and development of APIs that align to the product goals. The SaaS Dashboard tool provides the real-time performance of the API. The log traces are collected for each API—this is what a product manager is focused on.
- Business operations
The business operations team includes the order management, billing operation, account receivables operations, and partner operations team. Any customer dispute raised for orders, discounts or any related can be easily checked with the latest status on the transaction in the workflow. Once the status is identified, the respective operations team can take action on the subscription order.
Another key area where the tool comes in handy is the KPI metrics. If you can identify the right KPI for each API, then the dashboard can be set up with charts and graphs. With this enhancement, the tool becomes a ready reckoner for business decisions and work toward the North Star metrics.
- IT support
SaaS dashboard is a quick reference to check on the status of the APIs. Customization on the view can help setup for each status and the error message display on the UX.
The different section in the folder provides a quick reference for the failures and troubleshoot. Based on the support ticket details, the specific order or invoice can be queried and worked upon by the team. The tool can be tagged with an email alert to the support alias for a quick turnaround. In the SaaS world, SLAs are very tight, and this tool is the one to keep that intact and under control.
What’s next?
- KPI metrics—builds metrics to represent the performance of the product using graphs based on the KPI defined for each of the APIs
- SSO integration—extends the SSO login enabled for the external customers.
- Role-based access—restricts the access to each UI used based on the folder or list of APIs approved by the admin
- Email alert—triggers an email alert to the support team with the messages for quick response and triage for any API failures
- Daily health report—generates a daily report for the technical product managers based on the traces.
VMware on VMware blogs are written by IT subject matter experts sharing stories about our digital transformation using VMware products and services in a global production environment. Contact your sales rep or vmwonvmw@vmware.com to schedule a briefing on this topic. Visit the VMware on VMware microsite and follow us on Twitter.


