

This is blog four of a four-part series exploring why Tanzu Hub is a game-changer for platform teams.
In modern enterprise environments, observability is crucial for operating reliable, scalable application platforms and infrastructure. As applications become more distributed and infrastructure more layered, platform teams need tools that provide clear, real-time insights across the entire stack.
Today’s complex application environments task platform teams with managing numerous development teams, continuous deployment, diverse environments, and critical uptime expectations. Without real-time observability, identifying and resolving issues becomes slow, siloed, and reactive, leading to extended outages, missed SLAs, and dissatisfied stakeholders. Traditional monitoring tools often require custom integration, offer per-environment views, and necessitate constant context switching. What’s truly needed is a centralized view of all applications, enabling efficient monitoring and issue identification, and facilitating swift action to minimize business impact.
This fourth and final blog in our VMware Tanzu Hub series explores how Tanzu Hub empowers platform teams with unified observability and actionable visibility at scale, from the app to infrastructure, across your Tanzu Platform estate.
Built-in observability, out of the box
VMware Tanzu Platform customers receive end-to-end observability tailored for their Cloud Foundry environments within Tanzu Hub. As foundations are connected, Tanzu Hub automatically discovers applications, services, and connected infrastructure, giving platform teams a live view into performance, reliability, and capacity.
For platform engineering teams, the ability to monitor the entire application lifecycle, from code commits to production deployment, is critically important. Tanzu Hub aggregates and displays data on performance trends, deployment activity, error rates, and resource consumption. This comprehensive lifecycle view helps platform and application teams maintain alignment on operational health and delivery velocity.
Tanzu Hub collects and visualizes metrics across all foundations. This enables platform teams to see system behavior in real-time. For faster triage of potential issues, it includes in-context logging, pre-filtered to the specific application or foundation that you’re inspecting. This means no jumping between tools to find logs or metrics related to an alert.
Topology views for comprehensive visibility
Tanzu Hub’s powerful observability features include automatic topology views, offering real-time dependency mappings of your applications, services, foundations, and infrastructure. These views provide unparalleled transparency, showing how applications connect to platform services, where those services run, and the underlying infrastructure (e.g., VCF infrastructure) they depend on.
When events and alerts are reported, Tanzu Hub’s alert overlays integrate directly with VCF Operations. This allows platform engineers to click into specific details that route directly to VCF Operations for in-depth infrastructure-level events, creating a more deeply integrated troubleshooting workflow.
Topology views in Tanzu Hub also dynamically adjust based on your navigation, whether from an app, service, or foundation. This enables platform engineers to effortlessly shift perspectives without rebuilding dashboards or losing context.
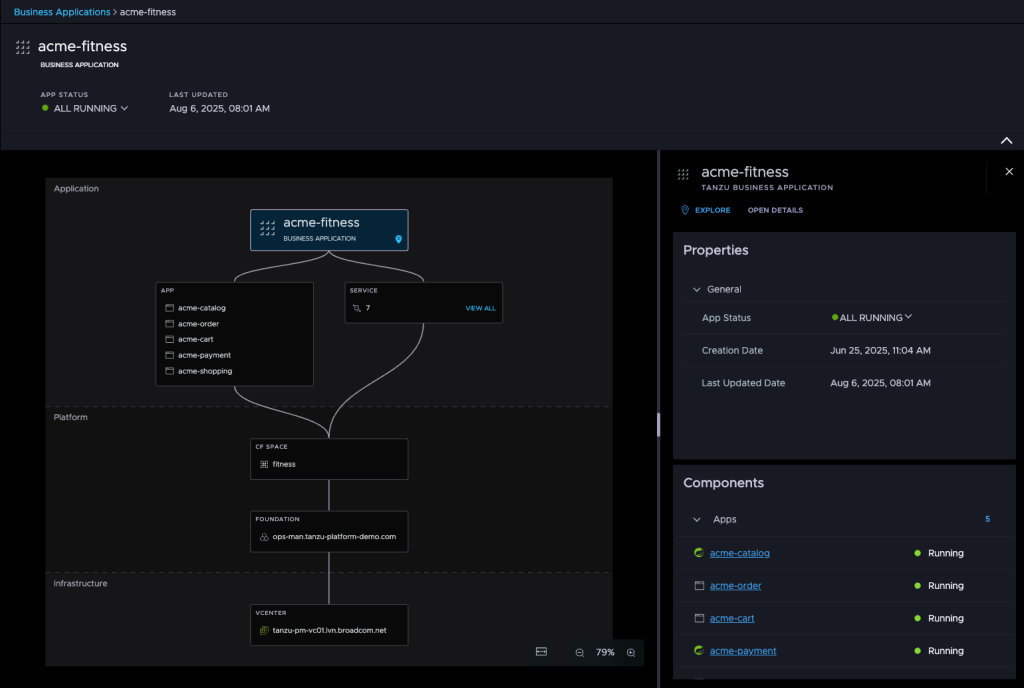
Figure 1: Here we can see the topology of the acme-fitness business application from within Tanzu Hub. Platform teams can interact with each level of the topology to further expand into dependent apps, services, spaces, foundation, and underlying infrastructure.
For instance, if an application experiences intermittent latency, a platform engineer can leverage Tanzu Hub’s topology view to:
- Trace the app’s service bindings.
- Identify performance issues surfacing at the service or foundation layer.
- Spot related infrastructure alerts in real-time.
- Access runbooks and metrics to guide the next steps in addressing issues.
This end-to-end insight significantly reduces the mean time to resolution (MTTR) and dramatically enhances the effectiveness of platform teams in keeping business-critical applications available and online.
Business application and infrastructure views
Tanzu Hub goes beyond merely observing systems and collecting data; it actively aligns them with your business operations. Applications and services can be logically grouped into “business apps.” For instance, an online financial system might include apps and services for online billing, customer identity, and fraud services. While these services might inherently depend on one another, their connection to the overarching business application might not be immediately clear. With Tanzu Hub, you can associate all of these components into a logical business application, enabling you to track overall health and availability, analyze performance trends for the entire application, better understand service dependencies, and review deployment history. This provides business stakeholders and application teams with the necessary visibility without requiring deep platform expertise.
Similarly, clear observability into our infrastructure is crucial. If business applications and environments rely on internally or externally managed infrastructure, direct visibility into the health of foundations, compute, network, storage utilization, environmental capacity, infrastructure events, and anomalies is essential. Tanzu Hub surfaces all of this information in a unified interface, eliminating the need for platform teams to chase telemetry across various toolchains.
Tanzu Hub has one other trick up its sleeve. Topology-linked runbooks are surfaced as alerts and events are triggered. Runbooks help codify institutional knowledge so that even new platform engineers can follow proven response patterns and take corrective actions confidently. Tanzu Platform 10.2 features both built-in runbooks and customizable runbooks for organizations to ensure issues can be addressed quickly and efficiently.
Figure 2: In Tanzu Hub, an alert was triggered for diego cell memory capacity. Here a live runbook instructs the platform engineer to deploy additional diego cells until memory capacity is at 33%

The benefits of observability at scale
Application uptime is dependent upon your ability to effectively observe your environment and address issues that may arise. Quickly troubleshooting issues has too long been plagued by disparate tools, context switching, and chasing potential bottlenecks across teams within the organization.
Tanzu Hub reduces MTTR by providing real-time alerts, in-context logging, topology-linked runbooks and more. It enables platform teams to take a more proactive approach to management with built-in anomaly detection, baselining and percentile analysis to understand environmental norms, allowing teams to move from reactive alerting to proactive and predictive insights.
Most importantly, Tanzu Hub is built to support multi-cloud, multi-foundation environments with the same levels of consistency and control, no matter how large your footprint grows.
Want to learn more about Tanzu Platform and Tanzu Hub?
Observability is more than just seeing, its about understanding and acting. As we’ve unpacked all of the capabilities and features of Tanzu Hub, its clear why customers trust Tanzu Platform to run their most critical and demanding business applications. Tanzu Hub is a game-changer because it packs the visibility, intelligence, and context to operate your Cloud Foundry environments at scale with confidence.
Reach out to your VMware account team for a guided demo of Tanzu Platform observability using Tanzu Hub. If you’re headed to VMware Explore in Las Vegas, stop by our Tanzu Platform booth, and see Tanzu Hub in action while connecting with our product teams who are shaping the future of private application platforms.
Stay tuned for more updates as we continue to expand the capabilities of Tanzu Platform!
Check out the previous blogs, in this blog series:
Part 1: Your Unified Interface for Application Delivery with Tanzu Hub
Part 2: At-Scale Management and Multi-Foundation Views with Tanzu Hub
Part 3: Smarter Workload Placement and Capacity Management with Tanzu Hub
Part 4: Observability and Visibility at Scale with Tanzu Hub


