
Observability is the lens through which platform teams gain an understanding of what’s happening across their application landscape. This includes everything from performance, alerting, and troubleshooting to deployment and Day 2 operations, such as capacity planning.
With VMware Tanzu Platform 10.3, Broadcom has introduced a suite of observability upgrades in Tanzu Hub that deepen visibility, accelerate team onboarding, and help minimize issue resolution times. Whether you’re responsible for reliability, platform engineering, or developer experience, the latest features can help you see automatically pulled, relevant data so that you can act faster and with even more trust in your platform. These enhancements bring a centralized, holistic observability experience to Tanzu Hub.
Key new enhancements in observability for Tanzu Hub
This release introduces enhanced topology and alert overlays, significantly improving visibility into infrastructure relationships and cross-foundation dependencies. Alert overlays now provide richer context, potentially linking directly to infrastructure systems or events within the VCF layer to streamline the triage process. Contextual alerts are designed to automatically map to the appropriate foundation, and in Tanzu Platform 10.3, this functionality extends to services and applications. These alerts will be visible across various views, including Home, Alerts, Foundations, Applications, Service Instance, and Topology.
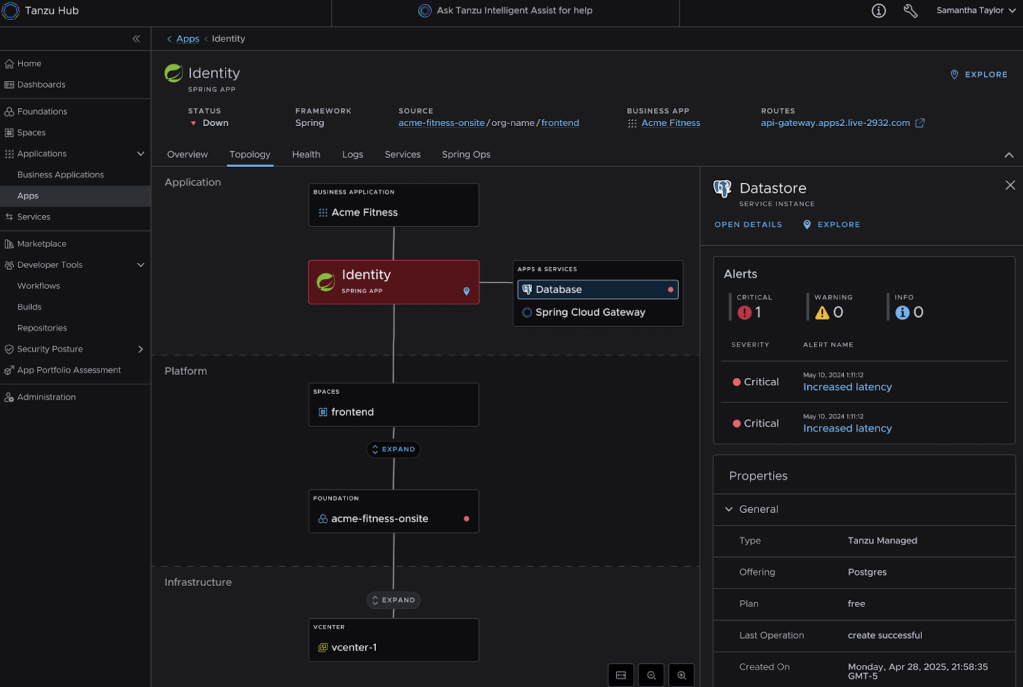
Tanzu Platform 10.3 has enhanced topology and alert overlays that bring new visibility for troubleshooting and service dependency awareness.
This release also offers new levels of observability and introduces significant enhancements to carefully curated dashboards and KPI-driven Tanzu Data Tile Services alerts and runbooks. This enables different teams to focus on codifying operational expertise, making it more accessible and actionable for both platform engineering and development teams of all experience levels.
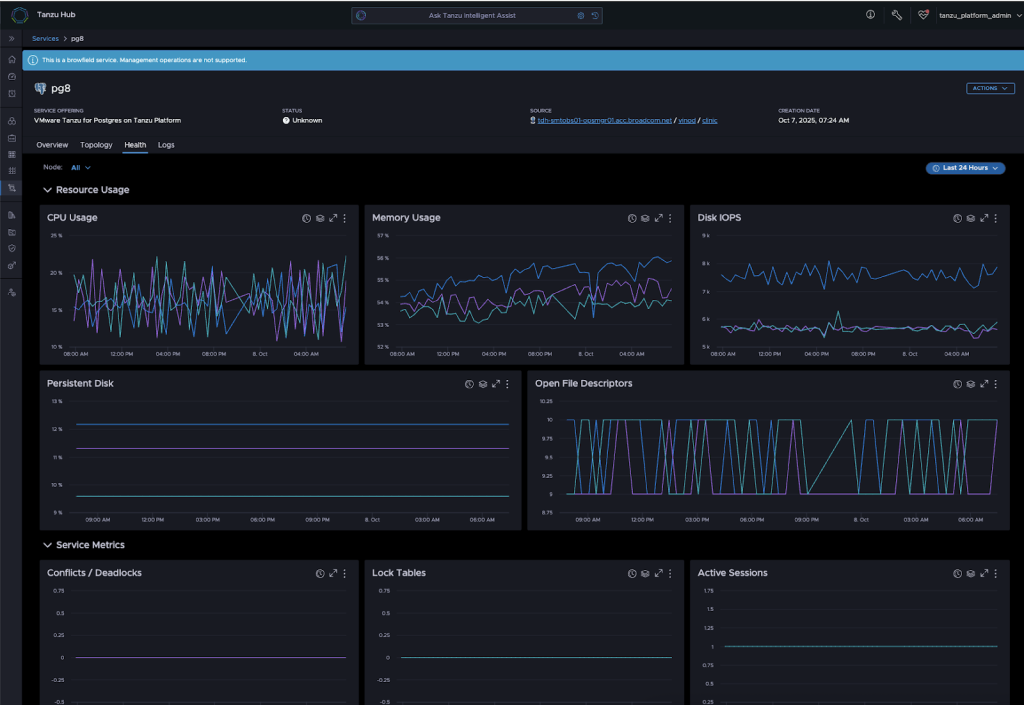
Updated observability features in Tanzu Platform 10.3 include new dashboards for data services tiles, like this health dashboard for Postgres.
A key aspect of these enhancements is the seamless integration of runbooks with observability flows. This means that alerts and alert resolutions are no longer living in isolated places; instead, runbooks are part of a broader system and now carry actionable next steps directly embedded within alerts, guiding engineers through troubleshooting and resolution processes step by step. Runbooks can be fully customized to show contextual data, such as relevant error logs during and before an alert was triggered, so your workflow is more streamlined and issue resolution time can be reduced. This integrated approach empowers teams working on resolving an issue—especially newly onboarded engineers—to act faster and more effectively, reducing the mean time to resolution and improving overall operational efficiency.
The unification of application-level and infrastructure-level metrics within the UI provides a truly holistic insight into system performance. This integrated approach allows for seamless correlation between application behavior and the underlying infrastructure’s health, offering a detailed view into the bound services or infrastructure-level changes that could impact the health of critical applications. By bringing these formerly disparate views together, and through the easy navigation experience of Tanzu Hub, organizations can more rapidly identify the root causes of issues, moving beyond surface-level symptoms to address core problems more efficiently.
These enhanced views deliver substantial business benefits and can be customized to fit the needs for different teams, including platform engineering and development teams. The ability to create and manage custom dashboards, coupled with robust data control through dashboard-level filters, empowers teams to tailor their monitoring experience precisely to their needs. Furthermore, the customization of layouts, charts, and widgets ensures that critical data is always presented in the most actionable way. This unification aims to address the majority of Healthwatch’s use cases, providing permission-based actions and advanced metrics exploration. The seamless migration of all Healthwatch dashboards, identifiable by a “healthwatch” tag, ensures continuity and easy discovery. Ultimately, these capabilities translate into reduced downtime, improved operational efficiency, and a more proactive approach to maintaining optimal application performance, directly impacting customer satisfaction and business continuity.
Why these enhancements matter
These enhancements deliver substantial business benefits, ensuring your platform operations are more efficient, reliable, and future-proof. Observability becomes more actionable and contextual, enabling full-stack analysis. You’ll gain a comprehensive understanding of not just application behavior, but also its direct ties to the platform and underlying infrastructure. This brings multi-foundation visibility, capacity planning, and compliance assurance. Runbooks and embedded guidance significantly reduce reliance on individual experience or tribal knowledge, fostering impactful, organization-wide operational efficiency. Finally, as environments continue to grow in complexity, these observability upgrades are designed to scale with you, ensuring sustained performance and visibility.
See for yourself
Tanzu Platform isn’t just getting another incremental update; its observability surfaces are evolving in lockstep with complexity. See how Tanzu Platform 10.3 can help your teams evolve along with it:
- Reach out to your sales team see a demo of Tanzu Platform 10.3 observability improvements
- Are you a current Tanzu Platform customer? Deploy Tanzu Hub in your environment!
- Keep an eye on the VMware Tanzu blog to learn even more about Tanzu Platform 10.3 and to see what comes next


