Monitoring systems are the life-blood of modern cloud-native application environments. They provide crucial performance visibility that’s essential to successfully configure, deploy, and troubleshoot applications and infrastructure.
But an often-overlooked question to consider is how well does your monitoring system monitor itself? If your DevOps teams are moving quickly with new software releases and infrastructure changes, problems with your monitoring pipeline resulting in visibility blindspots can bring your operations to a standstill. I’m certainly not the first to blog about monitoring the monitoring system; check out Adrian Cockcroft’s blog post on this same topic, Who Monitors the Monitoring Systems.
One of the many reasons that Wavefront is loved by dev and ops teams at large SaaS companies is its ability to not only monitor applications and infrastructure but also to monitor the components of the monitoring pipeline. In this blog, I’ll focus specifically on the Telegraf agent, a very popular, open source, metric collection agent used by many Wavefront customers. These customers have fleets of Telegraf agents deployed, so it’s important to know early if any instance is acting anomalous – using the same monitoring platform that monitors your cloud application environment, full-stack.
First, here are some more details about Telegraf. It’s an open source data collector agent which collects, processes and aggregates metrics from a wide range of input sources and writes them into a wide range of output sources. Telegraf is popular because it has 200+ plugins, strong community support, a minimal memory footprint, and ease of extensibility to create new plugins. DevOps teams often use many Telegraf agents to collect metrics from different sources at scale.
But like any data collection agent, anomalous operation could surface. As examples, a Telegraf agent could fall into some anomalous state, causing spikes in CPU or memory utilization, as well as missing metrics. So it’s essential to be able to monitor and troubleshoot Telegraf for possible root causes. This often involves getting answers to the following questions:
- Are all Telegraf agents healthy, and if not, which are ill?
- Are there any errors or metric drops seen in any of the Telegraf agents?
- How much memory is being consumed by each Telegraf agent?
- How many and what type of input and output plugins are enabled in each Telegraf agent? Are certain input plugins responsible for most of the load?
- Which Telegraf agents are the busiest, and which ones are sitting idle?
Easily Monitor and Troubleshoot Telegraf Performance with Wavefront
To get answers to the aforementioned questions, without Wavefront, someone had to manually check Telegraf logs on each server, which is a time-consuming process. But with Wavefront’s Telegraf integration, you now get a complete view of Telegraf agent performance metrics in a pre-built dashboard. Each dashboard section is arranged by metric type, making it easy to troubleshoot any Telegraf anomaly. For instance, right at the top of the dashboard, you can see important metrics such as the number of input and output plugins, drop rate and any errors seen by the Telegraf agent.
You can also browse any of the metrics collected from the Telegraf integration metrics browser, as shown below: Telegraf Agent Metrics in the Wavefront Metrics Browser
Telegraf Agent Metrics You Should Monitor
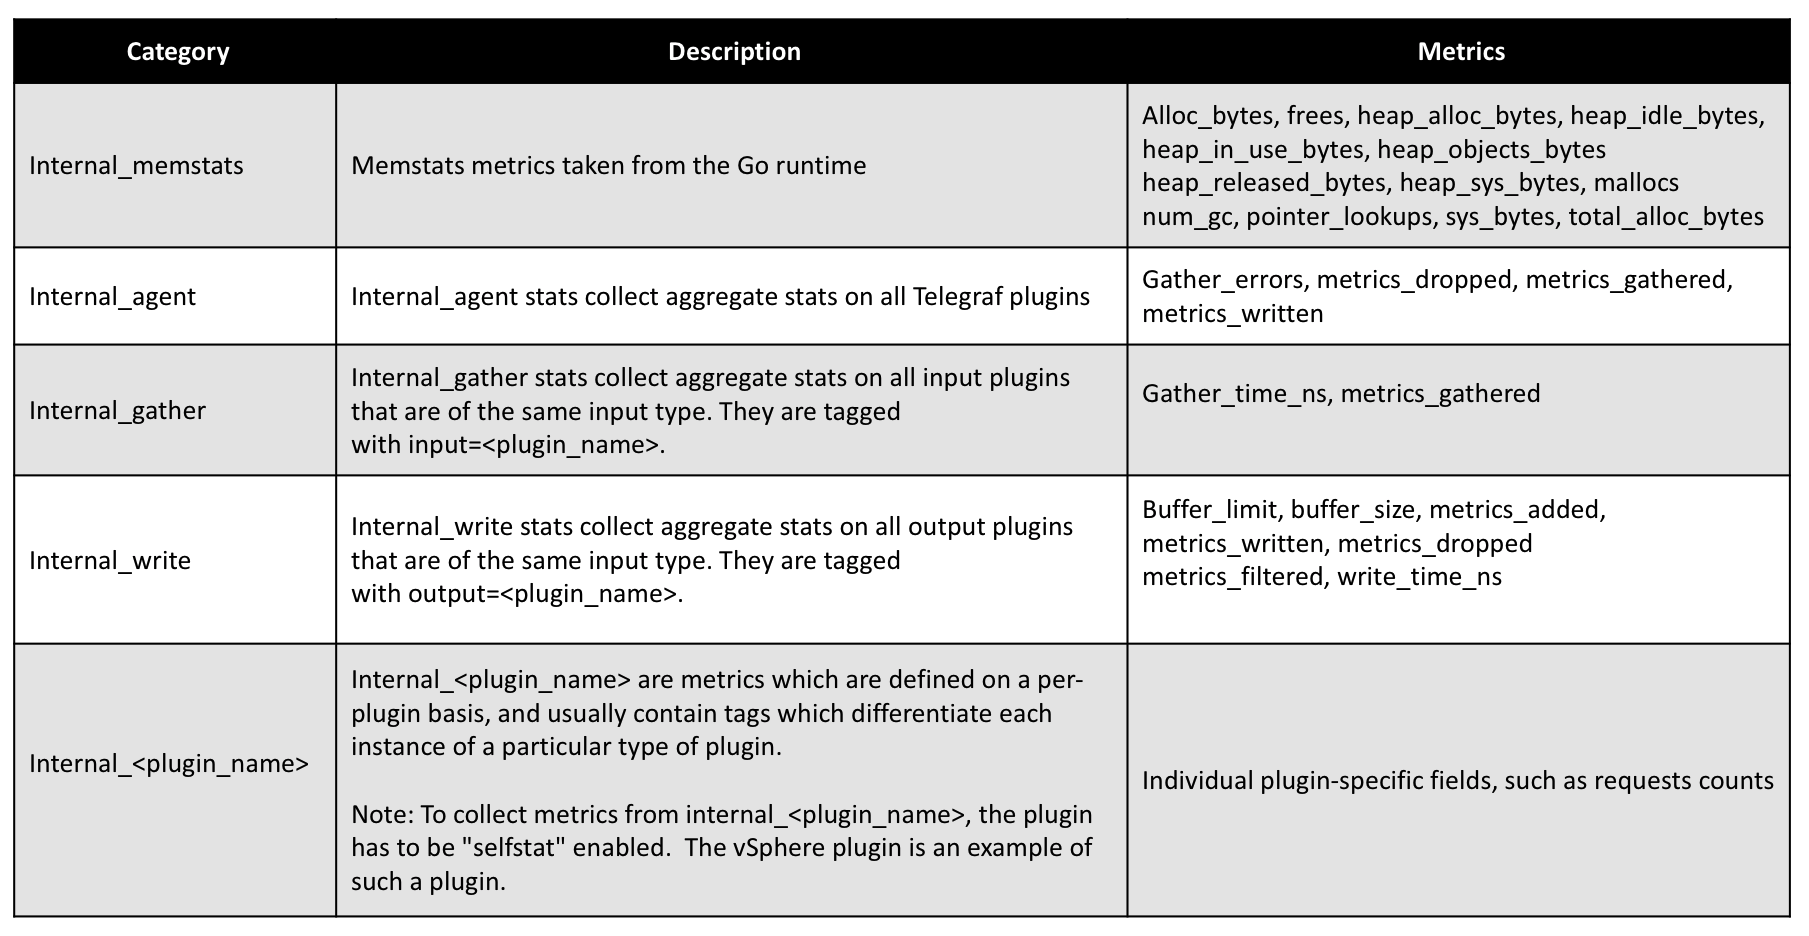
Wavefront uses the Telegraf Internal Input Plugin, to enable Telegraf self-monitoring and collect key performance metrics about itself, such as drop count, errors, allocated memory and enabled plugins. Below is a list of different categories of metrics collected by the Telegraf Internal Input Plugin:
These metrics are then sent to Wavefront, using the Telegraf Wavefront Output Plugin.
How to Configure Self-Monitoring Plugin
Follow along to learn more about how to configure a Telegraf agent to self-monitor and send its performance metrics to Wavefront. For starters, the Wavefront Output Plugin needs to be enabled. If it hasn’t already been done, refer to GitHub for details on how to enable the Wavefront Output Plugin.
Enable Internal Input Plugin
The “internal” plugin collects metrics about the Telegraf agent itself.
# Collect statistics about itself
[[inputs.internal]]
## If true, collect telegraf memory stats.
   collect_memstats = true
   name_prefix = "telegraf."
Now, reload the Telegraf agent for configuration changes to take effect as below command:
service telegraf reload
Sample Output
* Plugin: inputs.internal, Collection 1
> internal_memstats,host=hostname heap_in_use_bytes=6193152i,num_gc=2i,heap_sys_bytes=7929856i,heap_idle_bytes=1736704i,alloc_bytes=4678104i,total_alloc_bytes=6317224i,sys_bytes=11671800i,mallocs=25584i,frees=14789i,heap_alloc_bytes=4678104i,pointer_lookups=29i,heap_released_bytes=0i,heap_objects=10795i 1542293312000000000> internal_agent,host=hostname metrics_dropped=0i,metrics_gathered=1i,gather_errors=0i,metrics_written=0i 1542293312000000000> internal_gather,host=hostname,input=internal metrics_gathered=1i,gather_time_ns=167285i 1542293312000000000> internal_write,host=hostname,output=wavefront metrics_written=0i,metrics_filtered=0i,buffer_size=0i,buffer_limit=10000i,write_time_ns=0i 1542293312000000000
Summary
Monitoring your applications and infrastructure isn’t enough. You need to also monitor the monitoring system. This includes your fleet of metric collector agents, like Telegraf. Telegraf is popular because it can monitor lots of stuff. But with a fleet of Telegraf agents in use, DevOps teams often want to monitor the Telegraf Agent itself and ensure issue-free operation across the agent fleet.
Telegraf can be set to self-monitor its own performance using its internal input plugin. Wavefront has added this to its Telegraf integration along with a pre-built dashboard with all the Telegraf agent metrics, so you can easily monitor health and troubleshoot performance issues of any Telegraf agent.
There’s much more you can do with the Wavefront platform including using metrics-driven analytics to give you visibility across your entire cloud environment and improve your cloud application performance. Check out our rapidly growing list of integrations and sign up for our free trial to explore the power of real-time analytics and monitoring.
Get Started with Wavefront Follow @Gangadhar_3187 Follow @WavefrontHQ
The post Monitor the Monitors for Scale: How Wavefront Assures a Fleet of Telegraf Agents appeared first on Wavefront by VMware.


