
VMware vSphere 8 virtual topology (aka vTopology or vTopo) dynamically assigns vCPUs to virtual sockets for a VM based on the system’s socket and core count. This feature, which is enabled by default in new vSphere 8 VMs, can boost performance for some virtualized workloads. We conducted benchmark testing to determine whether vTopology improves the performance of an Apache Cassandra database virtualized on vSphere 8. We found that enabling this feature significantly improved the throughput of our Cassandra database benchmark workload.
Note: To change vTopology settings, see Virtual Topology in ESXi 8.0 at docs.vmware.com. Also see our performance study, VMware vSphere 8.0 Virtual Topology.
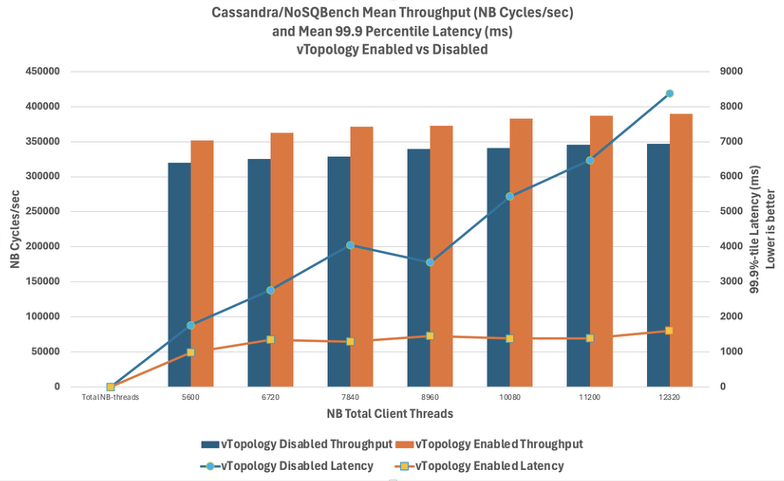
Apache Cassandra is a NoSQL distributed database designed for scalability and availability. Our Cassandra cluster consisted of 8 VMs, each with 14 vCPUs running on a 2-socket server with 28 cores per socket and 112 logical processors. With vTopology disabled, each VM had 14 sockets (1 per vCPU). With vTopology enabled, each VM had 1 socket with 14 vCPUs.
Figure 1 shows that the database workload performed better with vTopology enabled (as shown in the orange bars on the right). The bars show the gain in throughput (higher is better), which is measured in cycles per second.
The lines in figure 1 show the response time at the 99.9th percentile. The orange line shows improved performance with vTopology enabled—this is a lower latency than the blue line, which indicates our test results without vToplogy. The latency is measured in milliseconds (ms).
These gains in performance are due to more efficient scheduling made possible by better virtual topology alignment with the underlying physical hardware.
Figure 1. The NoSQLBench performance test result shows an increase in throughput for the Cassandra database workload when vTopology is enabled
Testbed and benchmark details
Hardware and VMs
The system under test was a single host running 8 Cassandra nodes (VMs):
- 1 x PowerEdge R650
- Intel Xeon® Gold 6330 @2.0GHz (Ice Lake)
- Logical processors: 112
- Memory: 512GB
- Network: 2 x 25Gb Ethernet adapters
- VMware ESXi 8.0.2
- Storage:
- 2 x NVMe RI U.2 3.84TB (each contained 4 of the 8 Cassandra VMs)
- 2 x NVMe MU U.2 1.6TB
- 1 x local ATA disk 223.57GB
The NoSQLBench client VMs ran on two of the hosts in a vSAN cluster:
- 3 x PowerEdge R650
- Intel Xeon® Gold 6330 @2.0GHz (Ice Lake)
- Logical processors: 112
- Memory: 1024GB
- Network: 2 x 25Gb Ethernet adapters
- VMware ESXi 8.0.2
- Storage (per host):
- 2 x NVMe RI U.2 3.84TB
- 2 x NVMe MU U.2 1.6TB
- 1 x local ATA disk 223.57GB
Cassandra VMs:
- 14 vCPUs
- 60GB memory
- 100GB hard disk on PVSCSI 0
- 300GB hard disk on PVSCSI 1
- vSwitch network adapter (25GbE NIC)
Client VMs:
- 14 vCPUs
- 64GB memory
- 100GB hard disk on PVSCSI 0
- vSwitch network adapter (25GbE NIC)
The Cassandra and NoSQLBench client VMs all used Rocky Linux 9.1, Cassandra 4.1, and OpenJDK 11.0.18. We installed NoSQLBench 4.15.104 on the clients. The Cassandra application used MAX_HEAP_SIZE of 32768MB and the Java HotSpot garbage-first collector (-XX:+UseG1GC).
Test methodology
We ran the initial baseline tests on vSphere 7. After we upgraded the test systems from vSphere 7.0.3 to vSphere 8.0.2, we observed no change in performance. When we applied the VM compatibility upgrade to these VMs (which increased the VM hardware version to 21, enabling vTopology) and retested, we saw the throughput immediately improve. The new vTopology feature configured each 14-vCPU Cassandra VM to use a single virtual socket instead one per vCPU (the default setting for VMs prior to vTopology in vSphere 8).
Cassandra
To keep the load as high as possible on the testbed, we increased the Cassandra replication factor (RF) to 2 and changed the consistency level (CL) to ONE to be equivalent to LOCAL_QUORUM when RF is 1. Increasing the RF to 2 means that each write operation goes to 2 Cassandra nodes instead of 1.
The Cassandra benchmark used the CQL-IOT workload that is provided with NoSQLBench. CQL-IOT defines a keyspace and column family for a time-series data model for Internet of Things sensor data and associated descriptive text fields. A workload mix of 90% writes and 10% reads was generated by 4 client VMs that ran the NoSQLBench tool against Cassandra nodes.
NoSQLBench
NoSQLBench allows the user to set other test parameters to control the benchmark. The first is the total number of test cycles (nbcycles), which determines how large the database grows during the test. The second is the number of threads (nbthreads) each NoSQLBench client will use to drive load. The read_ratio and write_ratio, 1 and 9 respectively, determine the percentage of these operations during the test. The benchmark measures the throughput in cycles per second as well as percentile latencies (for example, 99th percentile and 99.9th percentiles). We also monitored ESXi stats using esxtop. A test completes successfully when the clients running NoSQLBench have completed all the cycles they were assigned. The test fails if any client request times out before completing the number of cycles.
The total number of cycles was 600 million and each of 4 clients running on other servers handled 25% of the range. To increase the load on the Cassandra nodes (8 VMs), the number of NoSQLBench threads were increased in multiples of 28. Without vTopology enabled, each Cassandra node had 14 virtual sockets and was unable to keep up beyond 12,320 total NoSQLBench threads, as shown in figure 1.
Test results
With vTopology enabled, NoSQLBench was able to run successfully on the single virtual socket Cassandra at much higher benchmark thread counts. At the peak, the average throughput was 19.8% higher than the peak without vTopology enabled (415,609 cycles per second at 33,600 threads as shown in figure 2 vs 347,006 cycles per second at 12,320 threads as shown in figure 1). At these points, the average latency was 81% lower with vTopology enabled (1,583ms vs 8,373ms).
Figure 2. Benchmark test results for vTopology-enabled throughput, measured in cycles per second (orange bars), compared to latency, measured in milliseconds

Conclusion
With the vSphere 8 vTopology feature enabled, the Cassandra throughput reported by NoSQLBench increased by an average of 11.5% and the 99.9 percentile latency decreased by an average of 65%.
This new feature can result in throughput and latency improvements for your multi-vCPU workload VMs.
Discover more from VMware Cloud Foundation (VCF) Blog
Subscribe to get the latest posts sent to your email.


