

TPC Express Benchmark™ HCI was developed by the Transaction Processing Performance Council (TPC) for measuring the performance of hyper-converged infrastructures (HCI). TPCx-HCI stresses the virtualized hardware and software of converged storage, networking, and compute resources of the HCI platform. To demonstrate good TPCx-HCI performance, many components of the system need to be well-optimized:
- Software-defined storage, such as vSAN
- Live migration, such as vMotion
- Load balancing, such VMware DRS
- Hypervisor scheduler
- Compute performance
- Storage performance
- Networking performance
The TPCx-HCI workload is database-centric and models many properties of cloud services, such as multiple VMs running at different load demand levels and large fluctuations in the load level of each VM. Two unique characteristics of TPCx-HCI are:
- To model multi-tenant clouds, TPCx-HCI has an elastic workload that varies the load delivered to each of the VMs by as much as 16x, while maintaining a constant load at the cluster level. Sustaining optimal throughput for this elastic workload on a multi-node HCI cluster requires good intra-host and inter-host scheduling and load balancing. This property also measures the uniformity of access to data from all the Nodes.
- In the Data Accessibility test of TPCx-HCI, a Node is abruptly powered down, and the benchmark must continue to run on the other Nodes. The test sponsor (here, Supermicro) must include a throughput graph for this test, demonstrating the impact on performance, as well as report the recovery time to regain resilience.
First result published by Supermicro
Supermicro has published the world’s first TPCx-HCI benchmark result using the VMware HCI solution: vSphere 7 U2 virtualization, vCenter management, and vSAN storage. The cluster ran on four Supermicro AS 1114S-WN10RT servers, each with one AMD EPYC™ 7713 processor @ 2.0GHz and 1TB of main memory. Overall, in the cluster, the processors had a total of 256 cores with hyper-threading enabled for a total of 512 threads. The VMs ran the Red Hat Enterprise Linux 7.7 operating system and PostgreSQL 10.6 database management system (DBMS).
The Supermicro solution achieved the following score:
4,790.18 tpsHCI @ $49.60 USD / tpsHCI, available immediately
This score is discussed more thoroughly in the below section “Contributions of vSphere 7 to the score.”
Below is a diagram of the configuration used:
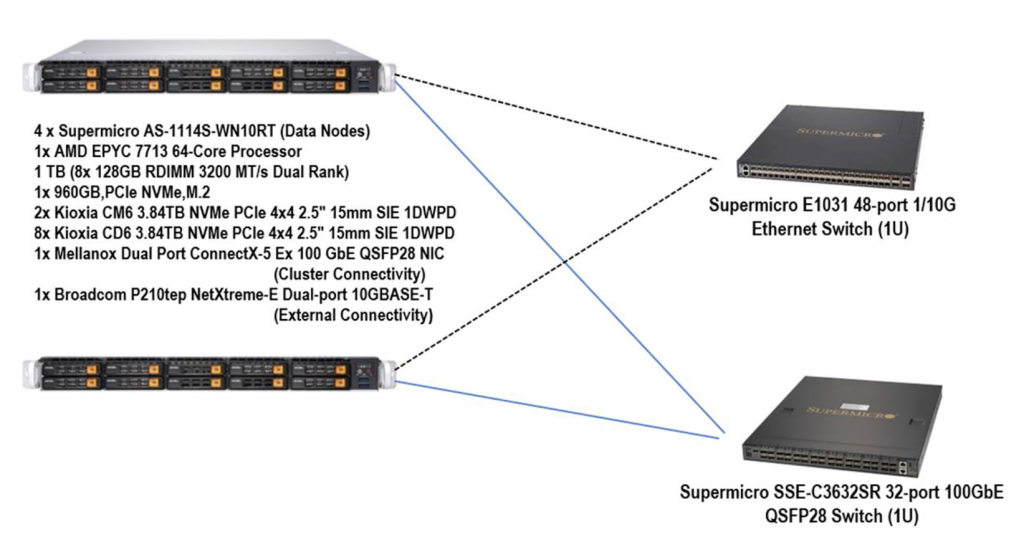
According to the Full Disclosure Report (FDR), vSAN was configured with two disk groups on each host. Each disk group had a mixed-use Kioxia CM6 3.84TB NVMe device for the cache layer, and 4 read-intensive Kioxia CD6 3.84TB NVMe devices as the capacity layer.
Quoting from the FDR for networking configuration, it consisted of:
- A 1GbE connection for IPMI.
- A dual-port Broadcom BCM57416 NetXtreme-E 10GBASE-T RDMA Ethernet Controller. One port was unused. The other port was used for “Management Network”. The vCenter Server Appliance accessed the hosts on this network.
- A dual-port Mellanox ConnectX-5 EN 100GbE card. Both ports were connected to the 100GbE Switch. One port carried the vSAN traffic and the transactions coming from the driver. The other port carried the vMotion traffic.
Contributions of vSphere 7 to the score
We are pleased that Supermicro chose vSphere 7.0 U2 for their disclosure. Release 7.0 of vSphere has many performance optimizations relevant to this workload. The next two subsections demonstrate how some of these optimizations were used in Supermicro’s result.
Inter- and intra-host scheduling and load balancing
One of the defining characteristics of HCI systems is uniform access to data from all Nodes. To evaluate how well an HCI cluster delivers that property, the TPCx-HCI workload was designed to benefit from inter-host load balancing and migration of VMs among the Nodes in the cluster. Aside from evaluating the uniformity of access to data, this measures the live migration speed, another important property of HCI clusters.
In keeping with the tradition of TPC benchmarks, the TPCx-HCI Specification does not require live migrations, nor does it choreograph how, when, or where load balancing should take place. Instead, the benchmark relies on the following two requirements to let a sponsor benefit from having an efficient load balancer. This also fosters advancing the state of the art in load balancing and in live migrations.
- A 4-Node implementation must use 5 Tiles (see the “Benchmark implementation” section further down in this blog). At the beginning of the benchmark run, all 60 VMs of the 5 Tiles must be on 3 of the 4 Nodes, with one Node having no VMs. Midway through the warm-up period, the test sponsor is permitted to enable load balancing on the cluster, allowing VMs to float to the idle Node.
- Using the elasticity feature in the benchmark, the proportion of the overall load sent to each VM is changed every 12 minutes while maintaining a constant overall load, as shown in figure 2 below.
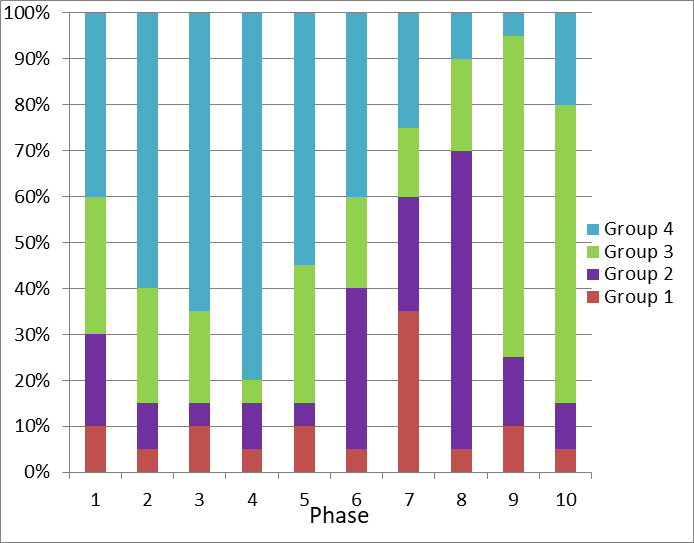
Imagine that the system is a private cloud that serves multiple tenants, each having a load that peaks at different times of the year. The overall load of the system does not change much, but it has to allocate resources to VMs differently depending on which tenant’s VMs are at their peak Phase.
So, the hypervisor on each host needs to choose the best resource allocation scheme to maximize the performance of all the VMs it is hosting. But having 5 Tiles on 4 hosts means the overall load on each host will not stay constant, and we also need inter-host load balancing to maintain good performance. Indeed, with the 5 Tiles all confined to 3 hosts at the start of the test, performance would be very poor without efficient load balancing.
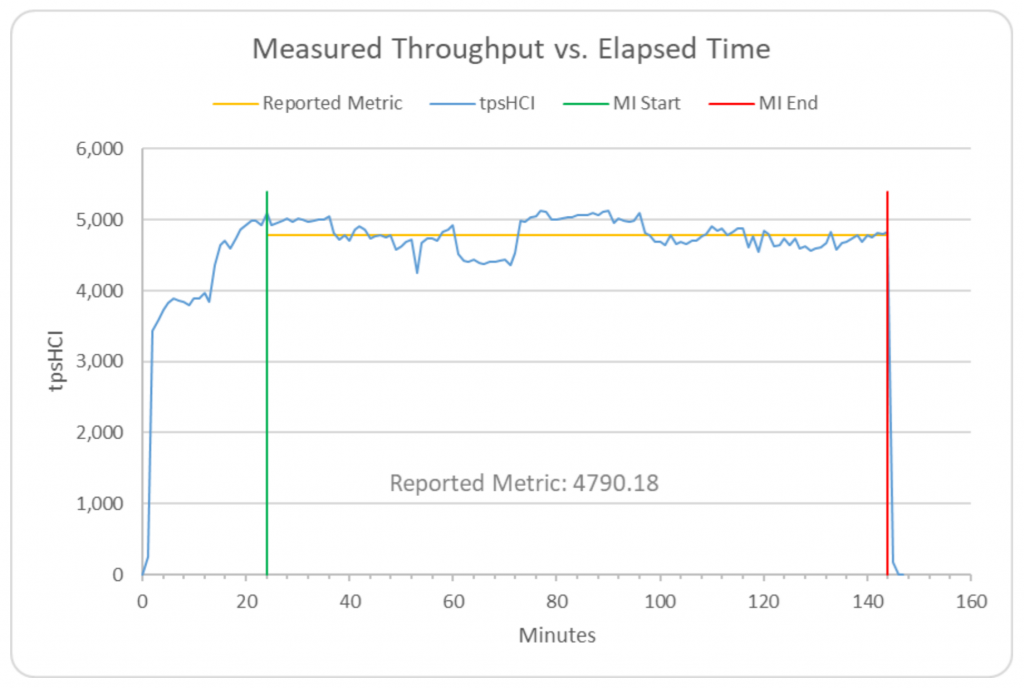
Figure 3 below is the graph of performance reproduced from the Supermicro FDR. There are 60 VMs with load levels that vary by as much as 16x every 12 minutes. The VMs were all on 3 hosts at the start of the test. As the graph shows, VMware DRS was enabled after 12 minutes, migrating some VMs to the 4th hosts. DRS continued to migrate VMs throughput the 2-hour run to keep the hosts balanced. According to Supermicro, the 12-minute moving average of throughput deviated from the reported throughput a maximum of 7.5%; maximum deviation of the 1-hour moving average of throughput was only 1.2%. This is a testament to the efficiency of the ESXi scheduler and VMware DRS that the testbed can maintain near-constant throughput in the face of 60 VMs changing their load with unpredictable, large variations.
Recovery from a lost Node
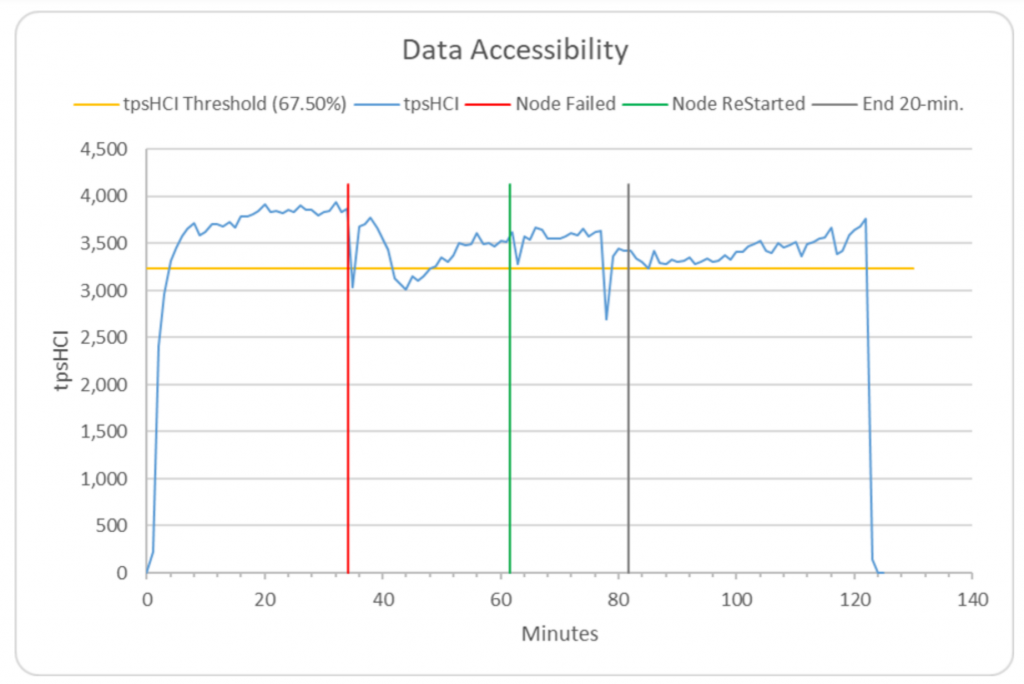
The Data Accessibility test of TPCx-HCI requires the demonstration of continued processing after a Node is completely lost. The actual test requires immediate, ungraceful shutdown of one of the Nodes. In the graph below, reproduced from the Supermicro FDR, we can see that after the Node was lost, processing continued with a small impact to performance. Recovery was complete after 2:05:38, and the system returned to the same state as before the loss of the Node. The testbed easily surpassed all requirements of the Data Accessibility test of TPCx-HCI. VMware vSAN 7 Standard edition was the key contributor to achieving this good performance.
Development of the specification and the benchmarking kit
VMware was a founding member of the subcommittee that developed the benchmark and has contributed significantly to the benchmarking kit used for TPCx-HCI. Unlike the older TPC benchmarks, which had paper specifications, and required a test sponsor to develop their own benchmarking kit from scratch, TPCx-HCI is a TPC Express benchmark, which means it comes with a turnkey kit. The TPCx-HCI benchmark is based on the single-system TPCx-V benchmark, and uses the same kit as TPCx-V, but the results of these benchmarks are not comparable. The number of VMs is calculated differently for the two benchmarks, even on similar hardware.
Benchmark implementation
Like many other virtualization benchmarks, TPCx-HCI uses a Tile-based architecture, where a Tile is the unit of replication of configuration and load distribution. A TPCx-HCI Tile has 12 VMs with different characteristics. A Tile consists of 4 Groups, each having one Tier A Virtual Machine and two transaction-specific Tier B Virtual Machines (see figure 5 below).
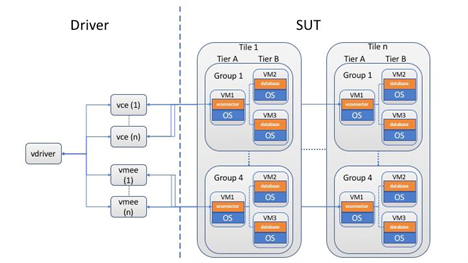
VM1 of each Group contains that Group’s Tier A, which runs the business logic application—it’s the database front-end, if you will. VM2 is the Tier B VM that holds the DSS database and accepts the two storage load-heavy DSS transactions. VM3 is the Tier B VM that holds the OLTP database and accepts the 9 CPU load-heavy OLTP transactions.
The 4 Groups have the same architecture, but different load levels. Over the 2-hour measurement interval, Groups 1/2/3/4 contribute an average of 10%, 20%, 30%, and 40% of the total throughput of the Tile, respectively. Furthermore, the load to each Group varies over the run time of the benchmark, as depicted in figure 2 in the “Inter- and intra-host scheduling and load balancing” section earlier in this blog.
Discover more from VMware Cloud Foundation (VCF) Blog
Subscribe to get the latest posts sent to your email.