
The DRS Dump Insight fling version 2.0 was released earlier this year; it makes sense of the drmdump files that the VMware vSphere Distributed Resource Scheduler (DRS) creates. This type of log file data is then presented in a series of intuitive visuals, so you can see what moves DRS has taken to enhance the workload balance of your VMs in a vSphere 6.0-7.0 U1 cluster managed by vCenter Server.
To use DRS Dump Insight, you upload the drmdump log files, which are found on your vCenter Server host, to the web app at https://www.drsdumpinsight.vmware.com/.
There are two versions of DRS Dump Insight: 1.0 and 2.0. With the introduction of DRS 2.0 in vSphere 7.0, the core DRS algorithm and drmdump format have changed significantly. This means there are significant differences while using DRS Dump Insight and understanding the drmdump analysis compared to the prior versions.
Some of the key differences between DRS 1.0 dumps and DRS 2.0 dumps include:
- Each DRS 1.0 dump corresponds to a single DRS run; no such correspondence exists for DRS 2.0 dumps.
- A DRS 2.0 dump contains two types of dump-sections:
- Full dump (aka cluster dump): Dumped periodically and the dump contains almost all the information required to reconstruct the cluster state.
- Partial dump: Dumped whenever a vMotion is initiated by DRS and there are power-on failures.
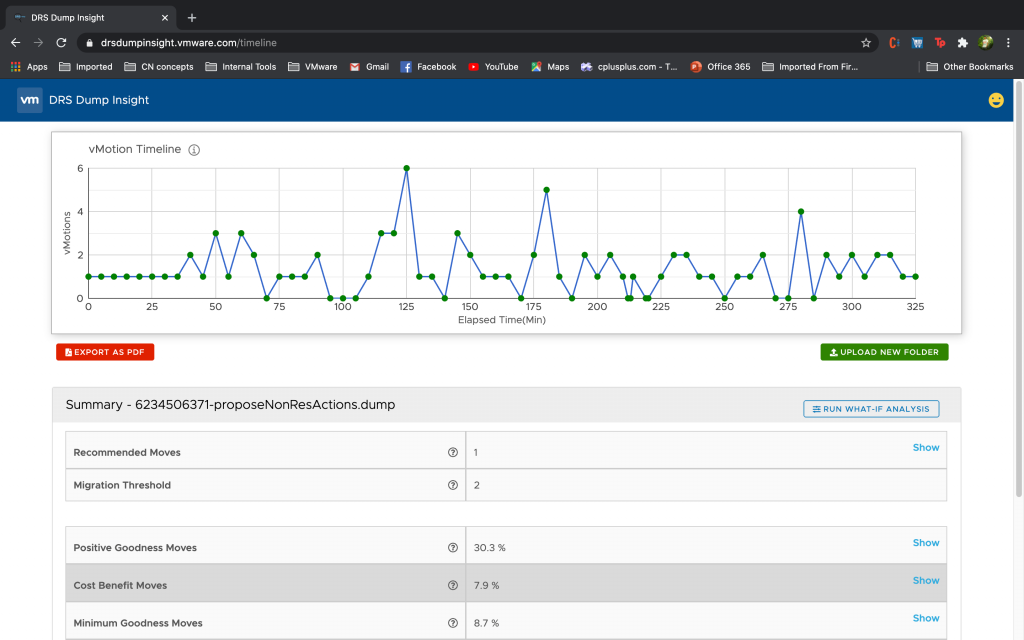
- The timeline in DRS Dump Insight 2.0 is very different from that of 1.0.
In DRS 1.0, the timeline includes a line chart:
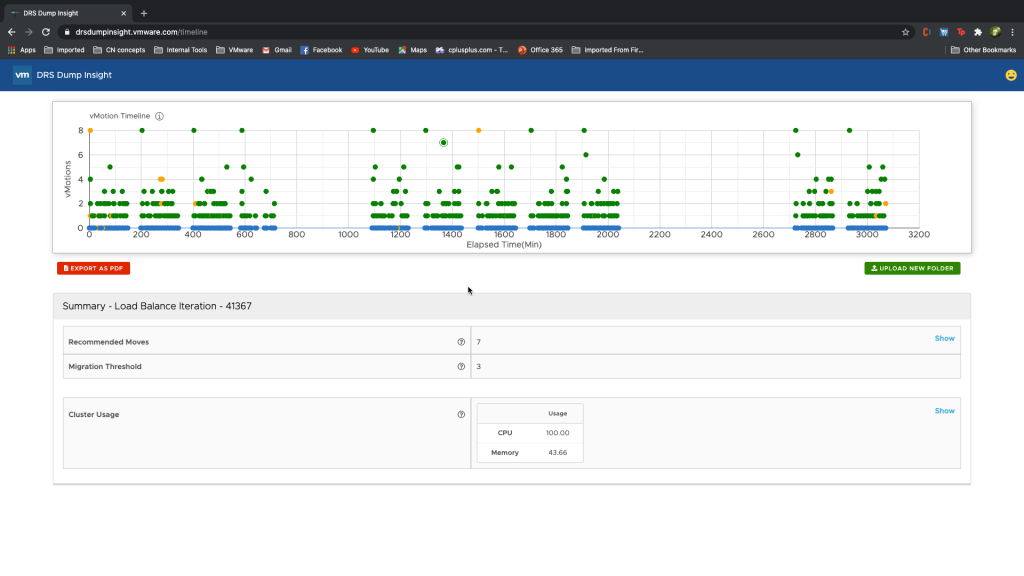
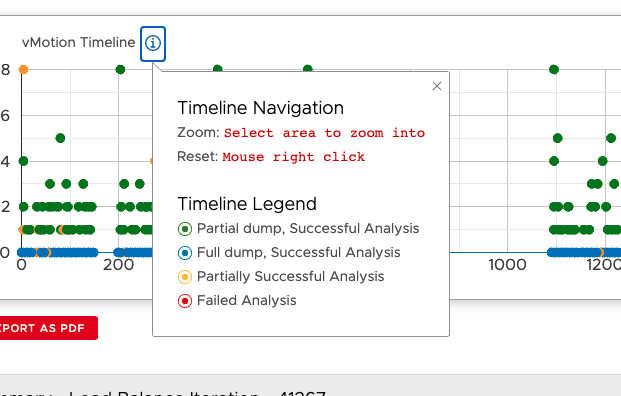
While in DRS 2.0, the timeline includes a scatter graph on which you can click each dot and learn more about the changes DRS made to the cluster:
To learn how to read these graphs and to understand how DRS Dump Insight works, see the DRS Dump Insight User Guide.
Discover more from VMware Cloud Foundation (VCF) Blog
Subscribe to get the latest posts sent to your email.