The release of VMware NSX-T 3.2 and VMware Container Networking with Antrea 1.3.1-1.2.3 delivers on VMware’s vision to have heterogeneous Antrea clusters running anywhere integrate with NSX-T for centralized container policy management and visibility.
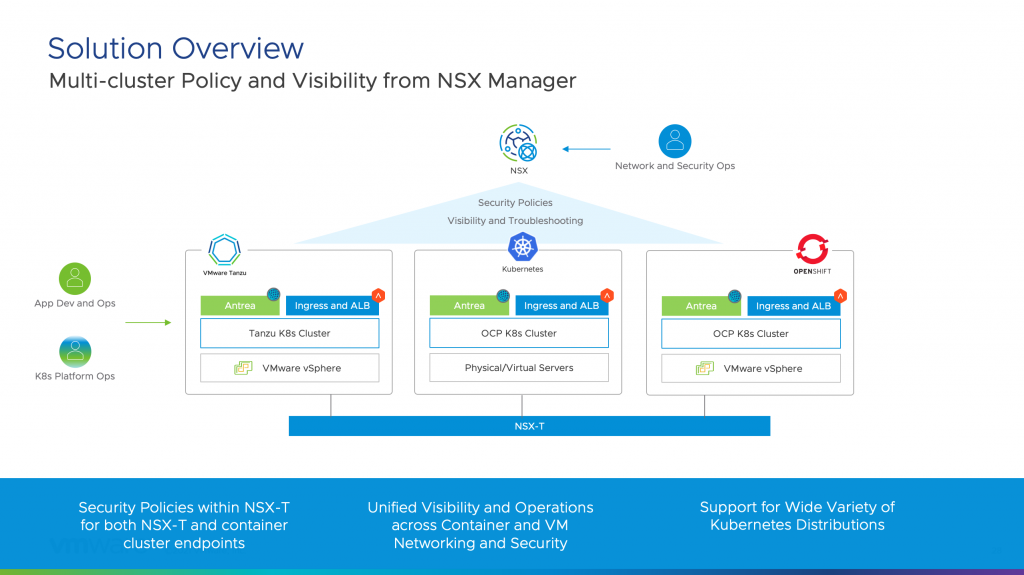
NSX-T becomes the single pane of glass for policy management when connected to Antrea clusters. The Antrea clusters could be running on VMware Tanzu platform, RedHat OpenShift or any upstream Kubernetes cluster. Inventory management, tagging, dynamic grouping and troubleshooting can be extended to Antrea clusters along with native Kubernetes network policies and Antrea network policies to be centrally managed by NSX-T.
Integrating Antrea to NSX-T
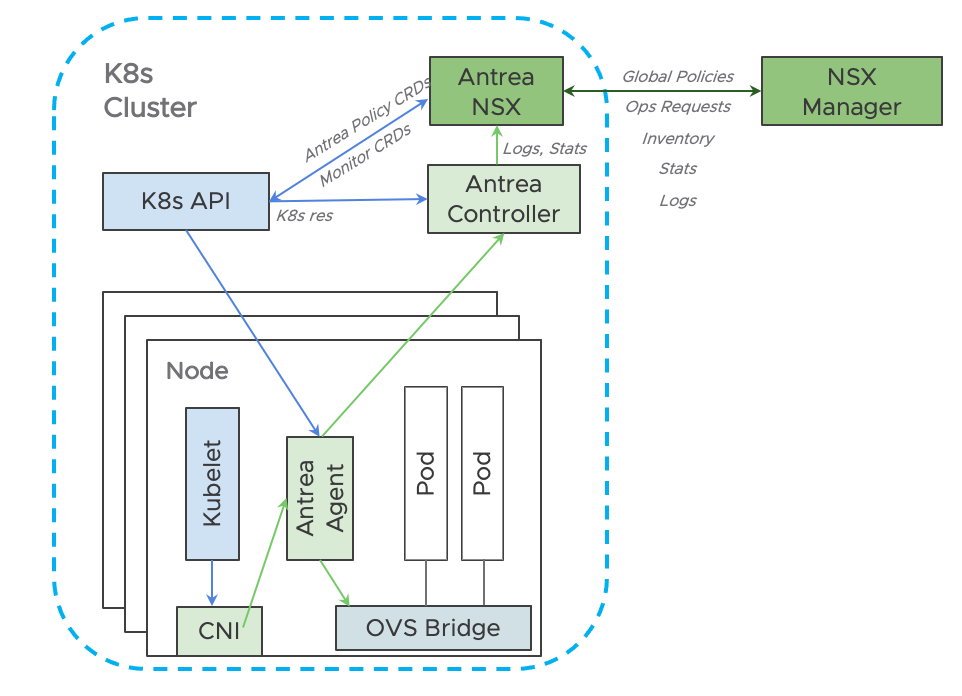
Antrea to NSX-T interworking Architecture
Antrea NSX Adapter is a new component introduced to the standard Antrea cluster to make the integration possible. This component communicates with K8s API and Antrea Controller and connects to the NSX-T APIs. When a NSX-T admin defines a new policy via NSX APIs or UI, the policies are replicated to all the clusters as applicable. These policies will be received by the adapter which in turn will create appropriate CRDs using K8s APIs. The Antrea Controller which is watching these policies run the relevant computation and sends the results to the individual Antrea Agents for enforcement. As these policies are run, statistics are reported back to the Antrea Controller for aggregation. Because the cluster is integrated with NSX-T, these aggregated values are reported to NSX-T adapter, which in turn reports back to NSX-T and made available to the admin.
In other words, Network Policies are defined in NSX-T but are enforced in Antrea. Detailed documentation about the architecture is available here.
Installation
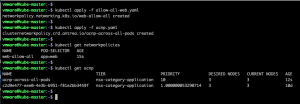
Installing the Antrea NSX Adapter is done by running the interworking pod in an Antrea cluster. The full set of requirements and detailed steps are documented in the guide here.
 Antrea Cluster with Interworking
The integration can be done at any point in the cluster lifecycle. Interaction with the cluster can continue with typical kubectl commands during and after the integration.
Central Visibility in NSX-T
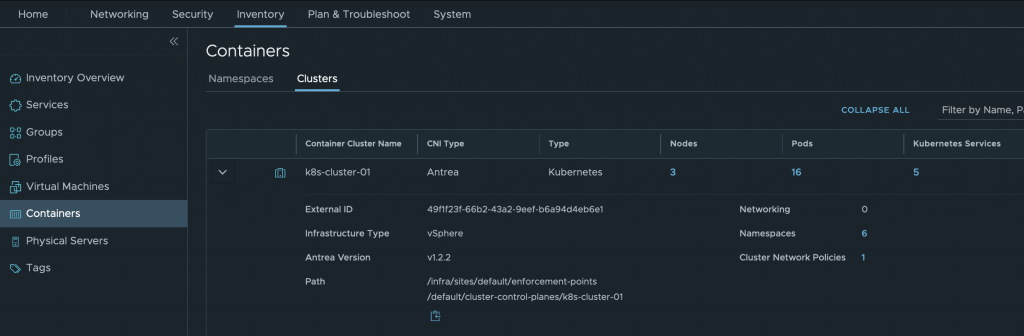
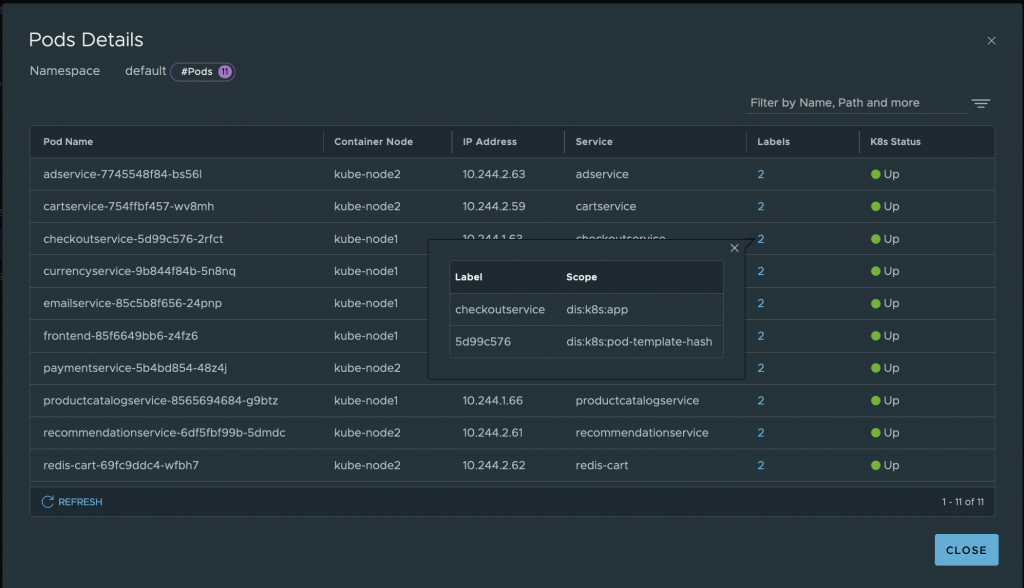
One of the benefits of integrating Antrea cluster to NSX-T is visibility of inventory in NSX-T UI. The Antrea NSX adapter exports details about the Cluster, Namespaces, Pods and even K8 Labels.
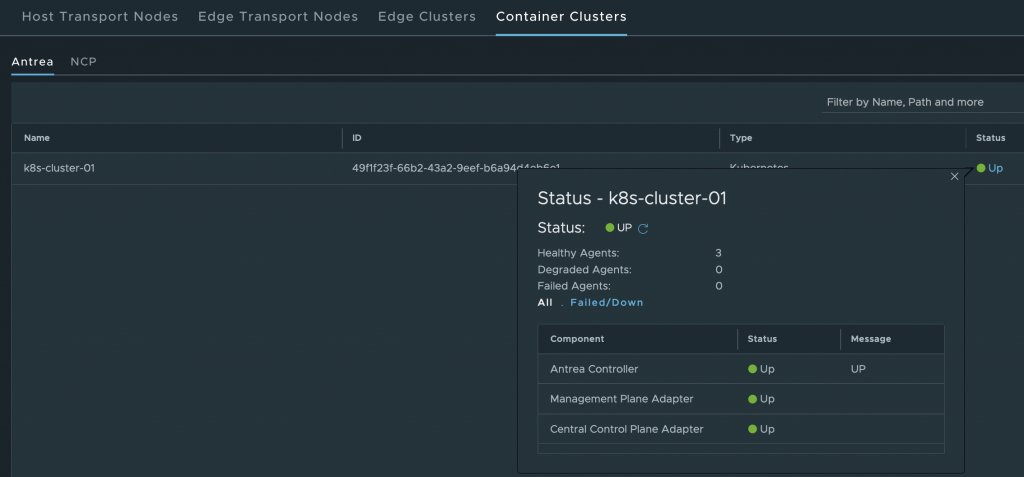
Once the cluster registration is complete, the Cluster information can be seen under System > Fabric > Nodes > Container Clusters
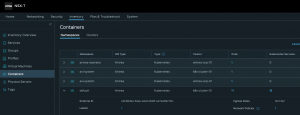
All the inventory information like Namespaces, Pods, Nodes, Services and Labels are available under Inventory > Containers. Browsing between the Clusters and Namespaces provides a complete view across all the different clusters registered with NSX-T. All in one single place!
 Inventory Cluster information
Along with the inventory, all k8s labels are automatically converted into NSX-T tags and can directly be used to create Dynamic Groups.
 K8s labels as NSX-T tags
Network Policy Management with NSX-T
Effective Network Policy Management is one of the key challenges of any K8s deployment. Typically native K8s NetworkPolicy or advanced AntreaNetworkPolicy management is done via kubectl in most deployments. With Antrea to NSX-T integration, AntreaNetworkPolicy management can be done centrally via the NSX-T manager UI.
In a typical scenario, the org admin or security admins want to centrally define network policies across all clusters and projects. However, the application developers still want the flexibility to continue to use existing workflows to define application level policies. In such cases, the admin can easily manage and define network policies from NSX-T. Any policies defined by the application developers are seen on NSX-T. The admin rules are enforced first and then rules set by application developers are enforced. Remember that since the enforcement is always done in Antrea, policies defined from anywhere are enforced in the right order.
To define a network policy through NSX-T, the standard DFW UI and APIs are leveraged. A DFW policy is first created, a container cluster is selected and then rules are defined. Specific services and/or groups can be selected and used in the rules.
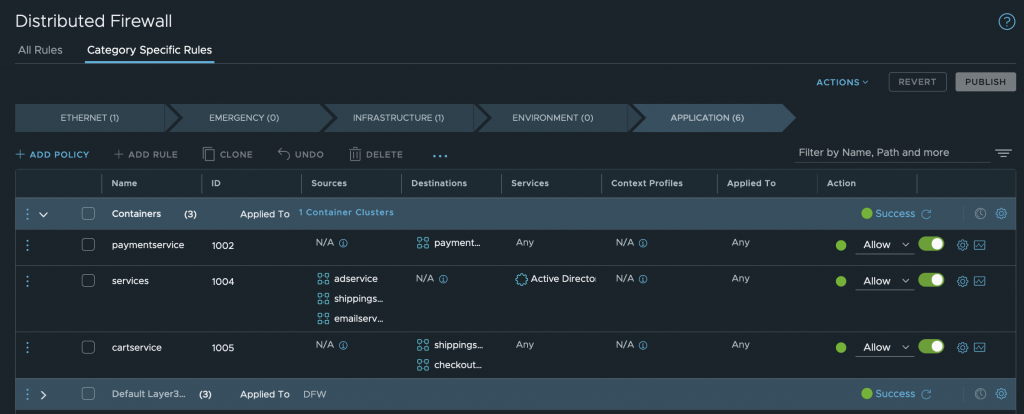 Kubernetes Network Policy in NSX-T
All of these, when published, will get translated to AntreaClusterNetworkPolicy and will be enforced in Antrea.
Enforcement of network policies in the Antrea cluster
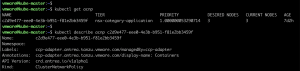
What about NetworkPolicies or AntreaClusterNetworkPolicies created in the Kubernets cluster via CLI? NSX-T can read those and make them available in the UI.
 Adding policies via CLI
The NetworkPolicy applied in the CLI has a Namespace scope. So this is visible under the Inventory > Containers > Namespace UI
 NetworkPolicy in NSX-T UI
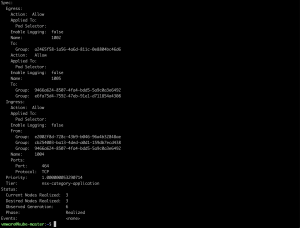
The AntreaClusterNetworkPolicy has a cluster scope. Hence this is visible under Inventory > Containers > Clusters
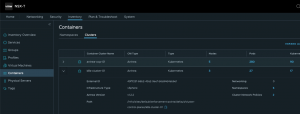 AntreaClusterNetworkPolicy in NSX-T UI
Groups for Containers in NSX-T
As mentioned before, all Kubernetes labels are translated as NSX-T tags. This means that Antrea groups can be created with membership criteria based on tags for Namespaces, Services or Pods.
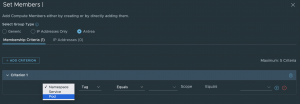 Creating Antrea Group Members
But what about the case where groups must be created that represent objects outside of the Antrea cluster? In this case, IP sets can be used to create Antrea groups to represent objects like Virtual Machines, Physical Servers, Applications or Services which reside outside of the Antrea cluster.
Leveraging NSX-T for Troubleshooting
Being able to centrally manage Kubernetes network policies centrally via NSX-T is great. But being able to troubleshoot Antrea clusters completes the story of NSX-T being the central pane of visibility for policy management and troubleshooting. Just like with Virtual Machines, NSX-T can be leveraged to trace the packet flow between two Pods. NSX-T can perform a packet trace between two Pods based on source and destination Namespaces, Nodes or Pods by leveraging Antrea Traceflow,
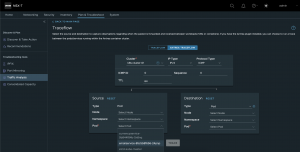 Antrea Traceflow with NSX-T
Once the trace is done, each hop the packet takes is visible along with any Network Policy it hits along the way. This provides invaluable insight into troubleshooting and debugging applications inside an Antrea cluster.
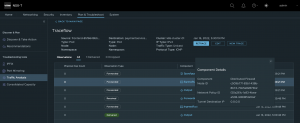 Antrea Traceflow with Packet Hot Details
Taking this a step further, support bundles from various Antrea clusters can be downloaded centrally from NSX-T.
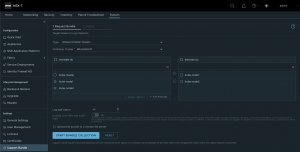 Download Antrea Cluster support bundles from NSX-T
Putting it all together
Antrea and NSX-T integration provides the right step towards building a solution that can have heterogenous Antrea clusters running anywhere hook to NSX-T for inventory, visibility and policy management. The Antrea cluster could be running on NSX-T backed infrastructure or could be running on physical/virtual networks or on retail/far edge location, NSX-T will still be able to provide a centralized policy model for Virtual Machines as well as Containers. Having a centralized policy model for both VMs and containers means infrastructure teams would be able to use a common policy model resulting in a more streamlined operations, while lowering OpEX.


Comments
0 Comments have been added so far