

Not very long ago, one of our co-founders wrote a post on the million-dollar question in the enterprise networking world. In that post, Ranga discussed how hardware load balancers cannot scale elastically, which is why even web-scale companies such as Facebook and Google leverage software load balancers for elastic autoscaling to match traffic requirements.
In this post, I walk you through the specific metrics your load balancer must monitor for efficient and intelligent autoscaling. The decision to scale-out or scale-in applications should be made based on the application’s performance, available resources, and saturation in underlying cloud infrastructure. App scale-out is desired when there is degradation in service quality, available resources, an increase in errors, and in application load. Conversely, apps must be scaled-in when it is over-provisioned.
The following metrics represent a cloud application’s performance and capacity:
- Application Service Quality (Latency): Latency is the most important indicator of an application’s performance. The backend pool server’s latency is the most obvious metric to monitor. Also, it is also important to monitor network quality experienced by the clients to access the service, i.e., network latency in reaching the service (round-trip-time). An application may be very fast, but clients may experience service degradation due to poor network access.
- Application Load: Production applications are typically benchmarked to establish the amount of load they can handle. The specific load metric may be different for different types of applications. For example, transactions-per-second is a reasonable load metric for a database application, whereas network throughput is a better metric for a video streaming server. The most commonly used metrics to measure the load for internet applications are the maximum concurrent open connections, network bandwidth, requests/sec, connections/sec, and SSL sessions/sec.
- Resource Utilization: Compute and storage resources are like oxygen for an internet application. All applications require CPU, memory, and disk. Many applications may saturate or slow down even before the CPU or memory has been exhausted. High resource utilization is one of the most common symptoms of an application that is slowing down.
In addition to the standard resource metrics mentioned above, Avi’s Service Engines have additional resources that are used to make intelligent and real-time decisions to scale-out and scale-in. Here is a quick summary of those metrics:
- Connection Memory Usage: This is the percentage of memory reserved for handling connections; rest of the memory allocated to a Service Engine is used for HTTP in-memory cache. Scale-out or increasing connection memory percentage is useful when connection memory is low.
- Syn Cache Usage: This is particularly useful in applications with significantly higher connections per second.
- Persistent Table Usage: This metric should be monitored when persistency settings are used in an application. Scaling up of Service Engines is the only recommended action to increase persistent table memory.
- SSL Session Cache Usage: New SSL connections cannot be established when an SSL session cache is full; scaling up of Service Engines is recommended to increase SSL session usage.
- Packet Buffer Usage (total, large, small, header): The Service Engines may run out of special memory segments used for receiving and transmitting packets on the network interfaces.
- In general, scale-out of Service Engines is a preferred course of action when shared resources such as CPU, memory, etc. are saturated. In instances where connection persistence is desired (such as cookie persistence, SSL session cache, etc.) scale-up of service engine is recommended. Scaling out, in other words, additional Service Engines does not help in such scenarios and could further downgrade the performance due to increased communication related to persistency.
- Errors – Errors may reflect saturation and the undesired state of an application. It may be required to scale-out when the rate of errors increase. However, an absence of errors does not signify the resources should be scaled-in. Here are some of the useful error metrics to consider for scale-out:
- Response errors: Applications return errors when they are not able to keep up with the load. For example, an application may fail transactions as they are not able to open new connections to the backend database.
- Failed connections: Applications fail to serve up the connections when they get overloaded, instead of gracefully queuing requests.
- Denial of Service (DOS) attacks: When applications are under undesired DOS attack, they should be scaled out to have enough capacity to serve legitimate clients.
- Availability: A key metric to decide when to scale-out is the operational state and availability of the application resources. If a pool server becomes intermittently unavailable, then a new server should be added to ensure clients do not suffer application outages.
Application Profile
The following sections provide a framework to choose different autoscale metrics for cloud application by identifying application’s performance and resource traits. Admins can match their application to one of the traits below and set up autoscaling.
- Basic Traits (ALL): Most common resources used by applications are CPU, memory, network, and disk. Also, they may have application-specific resources such as memory buffers, software locks, etc. Applications degrade when any of these resources are low. A best practice is to scale-out when any of these resources (CPU, Memory, or disk) are low and scale-in when there are plenty of resources.
- High Transactions applications (EX): e-commerce applications, consumer websites, and financial applications (ERP applications, IIS, Websphere, CMS systems like Drupal, Adobe experience Manager, e-commerce websites) are examples of high transaction applications. These applications slow down and have errors when they are close to their operational capacity. Scale-out should be setup based on the application’s maximum load benchmark. A good measure of the load is concurrent open connections as it reflects how busy is the server. Other metrics that represent load are the rate of connections and rate of requests.
- High throughput applications (BW): The high throughput applications have very high incoming or outgoing bandwidth requirements. Streaming servers, file sharing, and image servers are examples of such applications. For example, a streaming server limited to 10Gbps should be scaled out when throughput reached 9.5 Gbps and scaled in when throughput is less than 2 Gbps.
- Database applications (DB): Database intensive applications have both high amount of transactions and potentially vast disk I/O. When a database-centric application gets overburdened with traffic, the application typically slows down even before the CPU and memory squeeze occur. They are often setup with an internal configuration that defines their memory and CPU usage.
- High CPU applications (CX): In general, CPU is used independently of the application type. However, some applications are more CPU intensive than others. For example, any service that involves cryptographic operations like SSL termination, file encryption, graphics modeling, complex science models, simulation, analytics, etc. require a log of CPU. In such applications, just monitoring CPU may be enough to make scale-out and scale-in decisions.
Using Avi HealthScore for Autoscaling
Avi’s HealthScore can also be used to decide an application’s scale-out as the app health incorporates all the metrics described in the previous section into a single indicative number. Avi’s health score incorporates performance metrics and errors across network and application stacks. It degrades when there is not enough available resources or inconsistent performance. Application health, for an Avi Vantage user, therefore is the simplest way to setup autoscale policy in the absence of a good performance and resource benchmark for that application.
Autoscale Policy Example
Here is an example of how an Avi admin can configure scale-out and scale-in for an enterprise application that has been benchmarked to support 100 open connections at its peak and has an SLA requirement of <500ms latency.
Step 1: Setup Scaleout Alerts
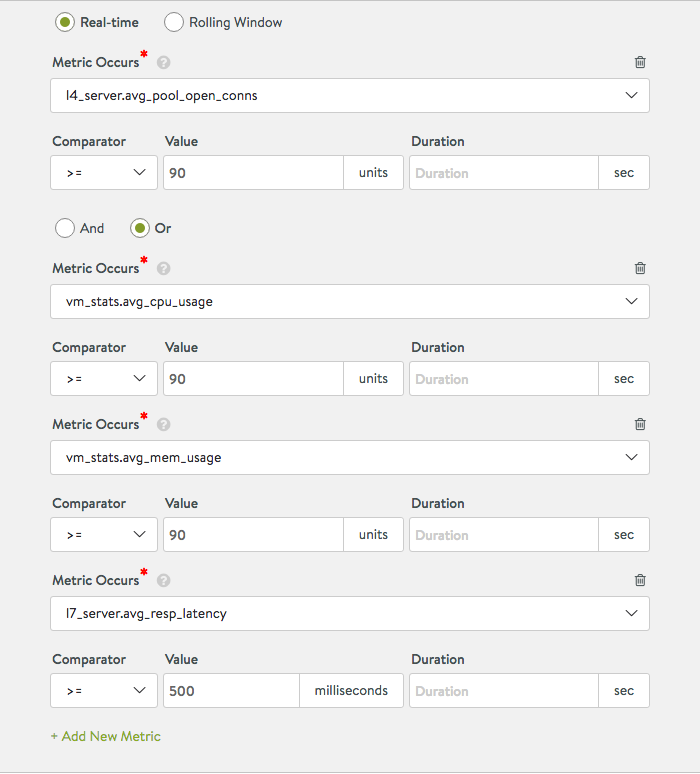
Setup alert configuration with following alert rule as
Scaleout Alert – Pools concurrent connections is greater than 90 or latency is greater than 500ms or CPU is greater than 90% or Memory is greater than 90%.
Step 2: Configure Scale-in Alerts
Now set up the scale-in alert such that performance is within the SLAs and there are plenty of resources.
Scale-in Alert – Pools concurrent connections are less than 20 and latency is greater than 400ms, and CPU is less than 20%, or Memory is less than 50%.
Step 3: Define Autoscale Policy
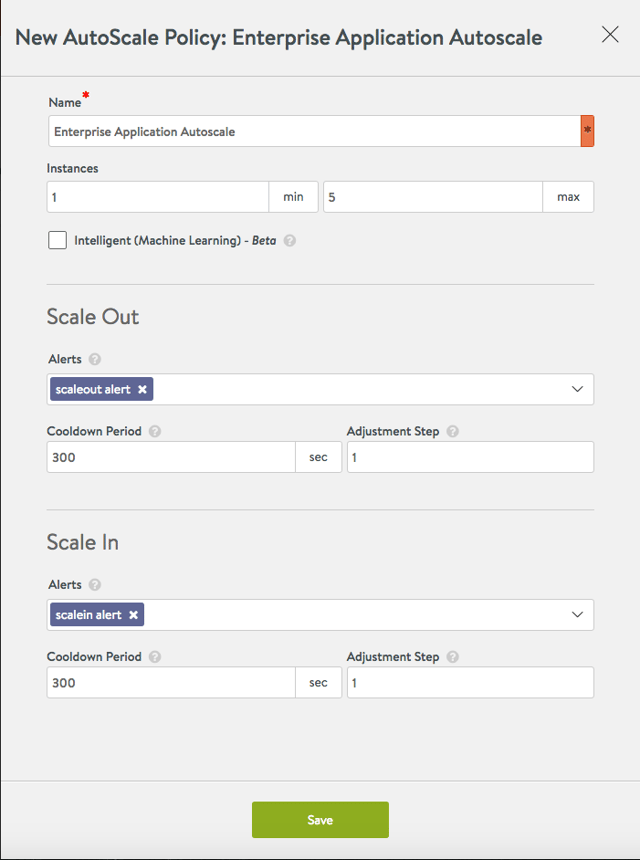
Select the “scale-out alert” in the list of Alerts to be used for scale-out.
Select the “scale-in alert” in the list of Alerts to be used for scale-in.
Step4: Attach Autoscale Policy to the Pool
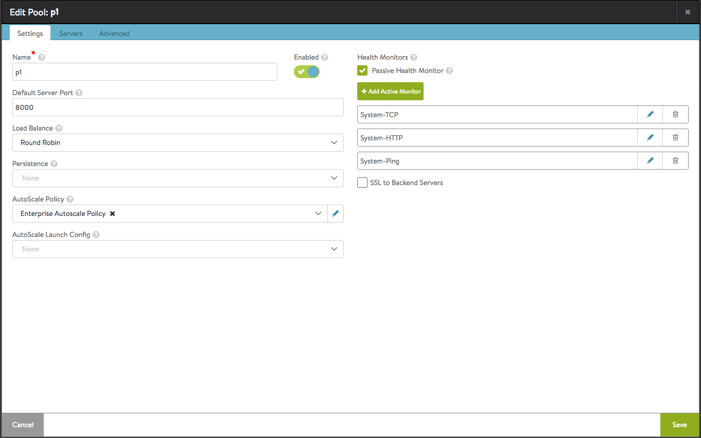
Choose the autoscale policy “Enterprise Autoscale Policy” in the Pool configuration.
Appendix – Metric IDs for use in AlertConfig and ServerAutoscale Policy APIs
| Type | App Type | Metric | metric_id |
| Health | Health Score | health.health_score_value | |
| Quality | ALL | Application Response Latency | l7_server.avg_resp_latency |
| Client Access latency | l7_client.avg_client_data_transfer_time | ||
| Network Latency | l7_client.avg_total_rtt | ||
| Server network latency | l4_server.avg_total_rtt | ||
| Load | DB, EX | Pool Open Connections | l4_server.max_open_conns |
| ALL | Per-Server Pool Open Conns | l4_server.avg_pool_open_conns | |
| ALL | Pool network connection quality (Apdexc) | l4_server.apdexc | |
| DB, EX | Per-server Pool connection rate | l4_server.avg_pool_complete_conns | |
| MX | Per-Server Pool Bandwidth | l4_server.avg_pool_bandwidth | |
| EX | Per-server new connections | l4_erver.avg_pool_new_established_conns | |
| EX | Pool Response Quality (Apdexr) | l4_server.apdexr | |
| EX | Request rate | l7_server.avg_complete_responses | |
| DB, EX | Per-server response rate | l7_server.avg_pool_complete_responses | |
| Availability | ALL | Pool Uptime | l4_server.avg_uptime |
| Errors | ALL | Connection Errors | l4_server.pct_connection_errors |
| ALL | Request Errors | l7_server.pct_response_errors | |
| ALL | DDOS | l4_client.pct_connections_dos_attacks | |
| ALL | Pct DOS packets | l4_client.pct_pkts_dos_attacks | |
| ALL | Pct SSL failed connections | l7_client.pct_ssl_failed_connections | |
| Resources | ALL, CX | CPU | vm_stats.avg_cpu_usage |
| ALL | Memory | vm_stats.avg_mem_usage | |
| ALL | Disk | vm_stats.avg_disk1_usage, vm_stats.avg_disk2_usage, vm_stats.avg_disk3_usage, vm_stats.avg_disk4_usage | |
| SE – Load Balancer | ALL | SE CPU | se_stats.avg_cpu_usage |
| ALL | SE Memory | se_stats.avg_mem_usage | |
| ALL | SE Disk | se_stats.avg_disk1_usage | |
| ALL | Syn Cache usage | se_stats.pct_syn_cache_usage | |
| ALL | Connection Mem usage | se_stats.avg_connection_mem_usage | |
| ALL | Packet Buffer Usage | se_stats.avg_packet_buffer_usage | |
| ALL | Large Packets Buffer Usage | se_stats.avg_packet_buffer_large_usage | |
| ALL | Small Packets Buffer Usage | se_stats.avg_packet_buffer_small_usage | |
| ALL | Header Packets Buffer Usage | se_stats.avg_packet_buffer_header_usage | |
| DB, EX | Persistent Table Usage | se_stats.avg_persistent_table_usage | |
| SSL | SSL session cache usage | se_stats.avg_ssl_session_cache_usage |


