vSphere with Tanzu allows admins to transform vSphere to a platform for running Kubernetes workloads natively on the hypervisor layer.
When workload management is activated on a cluster, it is thereafter referred to as the Supervisor. It provides the capability to run workloads directly on the ESXi, known as vSphere Pods. Workloads can also be deployed and run on a Tanzu Kubernetes Cluster which is created by the Tanzu Kubernetes Grid service.
A Supervisor can be activated from the vSphere UI client, with compute and storage resource requirements varying based on the desired size of the deployment. More information about Workload management can be found here.
In this post, the focus is on the monitoring aspect via the UI. It provides insight on the configuration process for activation, deactivation, upgrade, or any other reconfiguration. With the existing UI, a user can navigate to Workload Management and then select the Supervisors tab to find a list of all Supervisors. The ‘Config Status‘ column shows the overall status of the configuration operation, which can be one of the following
| Running | configuration has been applied successfully, the Supervisor is up and running |
| Configuring | configuration is being applied to the Supervisor in order to reach the desired state |
| Removing | Supervisor is being deactivated |
| Error | an error occurred while applying configuration |
Prior to vSphere 8.0, the configuration status value was the only one available to indicate progress during a configuration operation. In the case of an error, warning or some other important message coming from the service, a link would be displayed alongside status. Upon clicking on it, user would get a modal with a flat list of the messages displayed in a grid
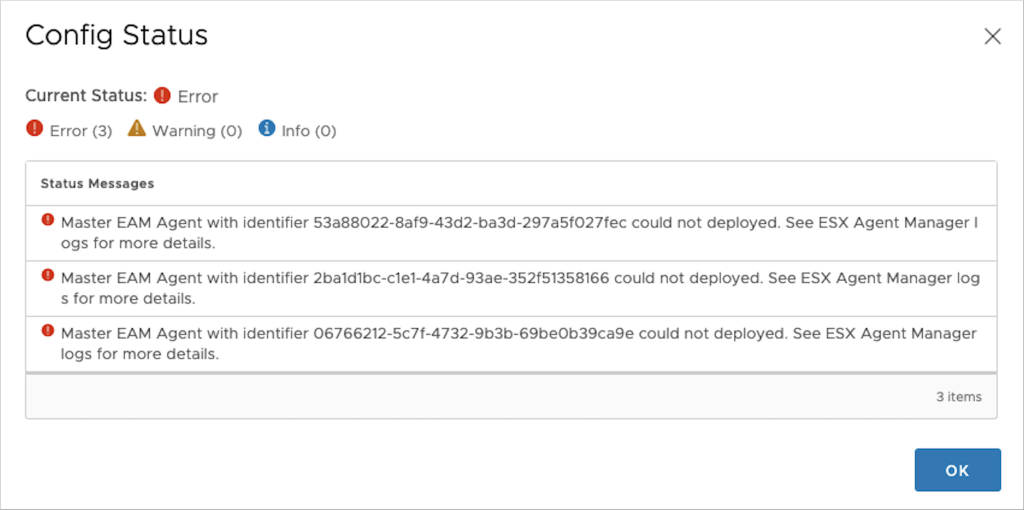
Messages retrieved from the service, however, are not necessarily fatal and can sometimes be rectified in the next control loop run. Now, you might be wondering, what is a control loop?
To configure workload management, a specification must first be created (key-value pair structure) which is then passed on to the service through a configuration API. The service, subsequently, is responsible for bringing the existing configuration to the desired state. It does so by running a control loop that step by step, brings it closer to it, by executing actions specific to the configuration operation. Thus, an error does not always mean that the overall outcome of the process is a failure, but rather that the current loop encountered an issue that will be retried.
With newer vSphere releases (8.0 and later), whenever workload management is in a configuration state, a link will be displayed alongside its status.

To reach all entry points for this new modal, follow these navigation steps
- Navigate to Workload Management, then select Supervisors tab to reach Supervisors list. View status from Config Status column on the grid for each Supervisor
- Navigate to Workload Management, then navigate to a particular Supervisor. View the configuration status from the Summary page
- Navigate to Workload Management, then navigate to a particular Supervisor. View the configuration status from the Monitor page
Clicking on the link brings up the new conditions modal dialog.
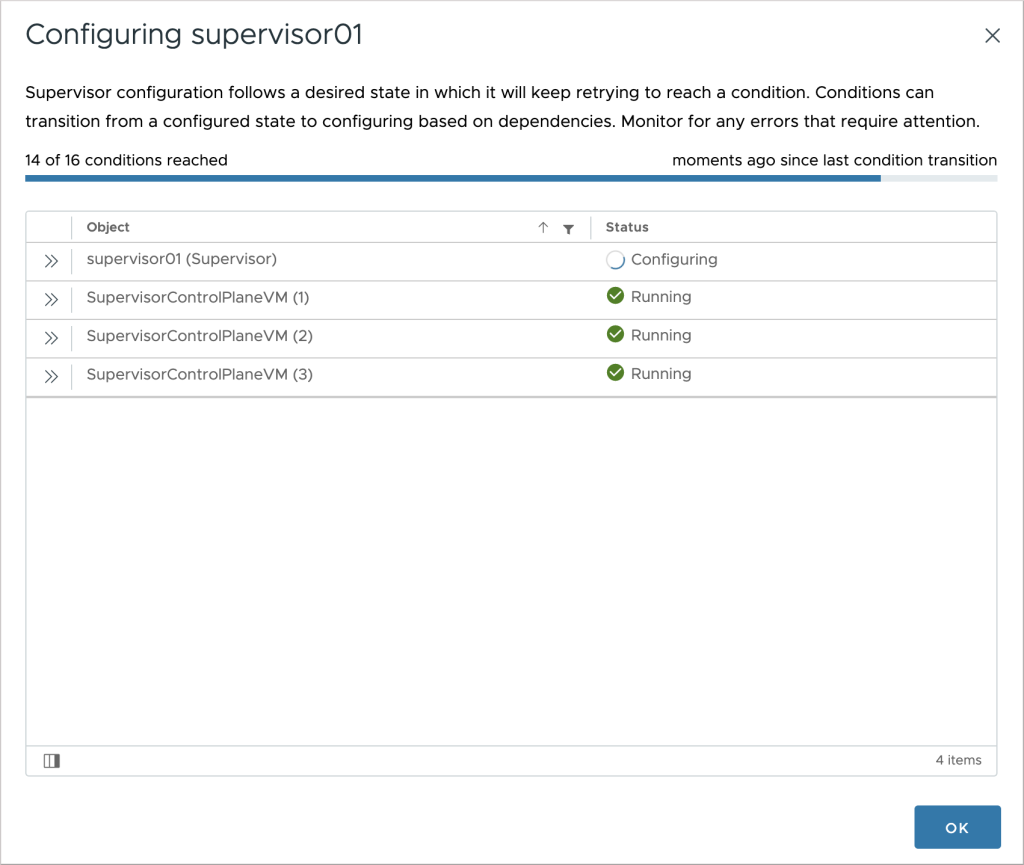
The first thing that comes up is a bird’s eye view of the configuration process. Conditions are set on the participating objects, and those must reach the desired state before considering the operation successful. The number of conditions that have reached the desired state out of the total number of conditions is displayed on the top left. On the top right, we have the time that passed since the last condition status change, expressed in minutes. That can be help understand if something is happening “behind the scenes”. In the grid below, in addition to the overall status of the supervisor, we can also find the status for each one of the control plane nodes, which changes dynamically as they get deployed and configured. We can get more details for each object individually by clicking on it.
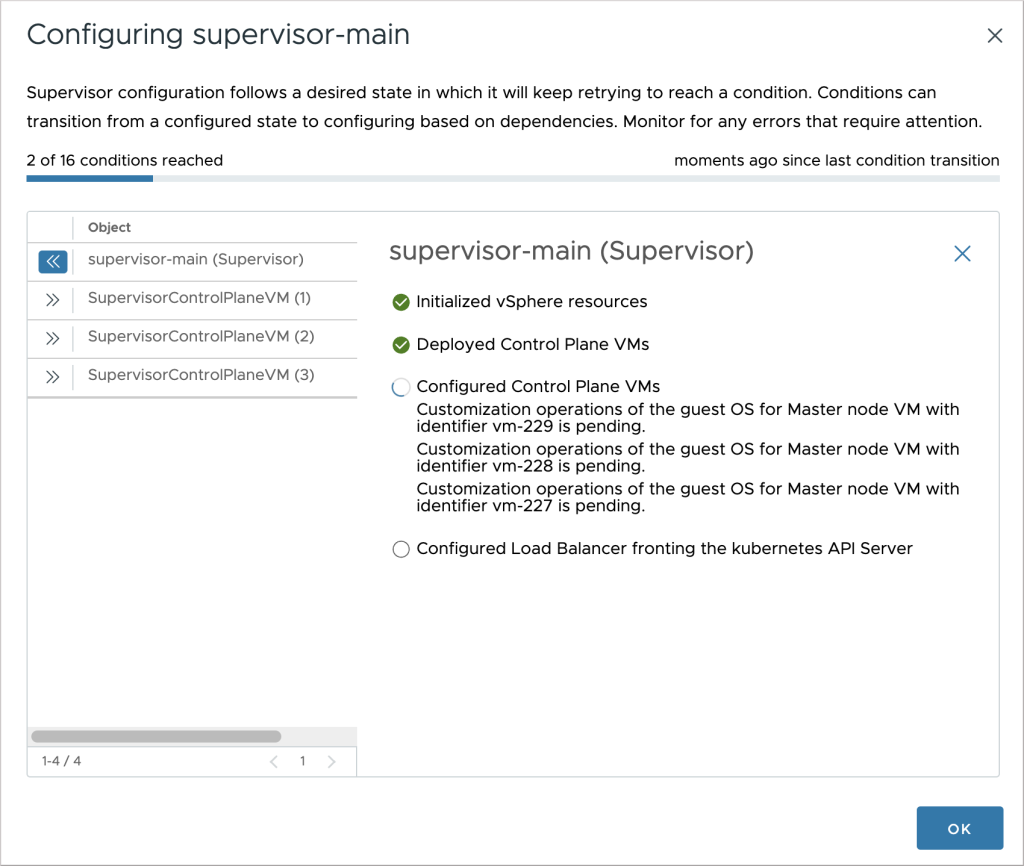
The UI updates itself automatically whenever new data arrives from the service, and thus there is no need for the user to do a manual refresh.
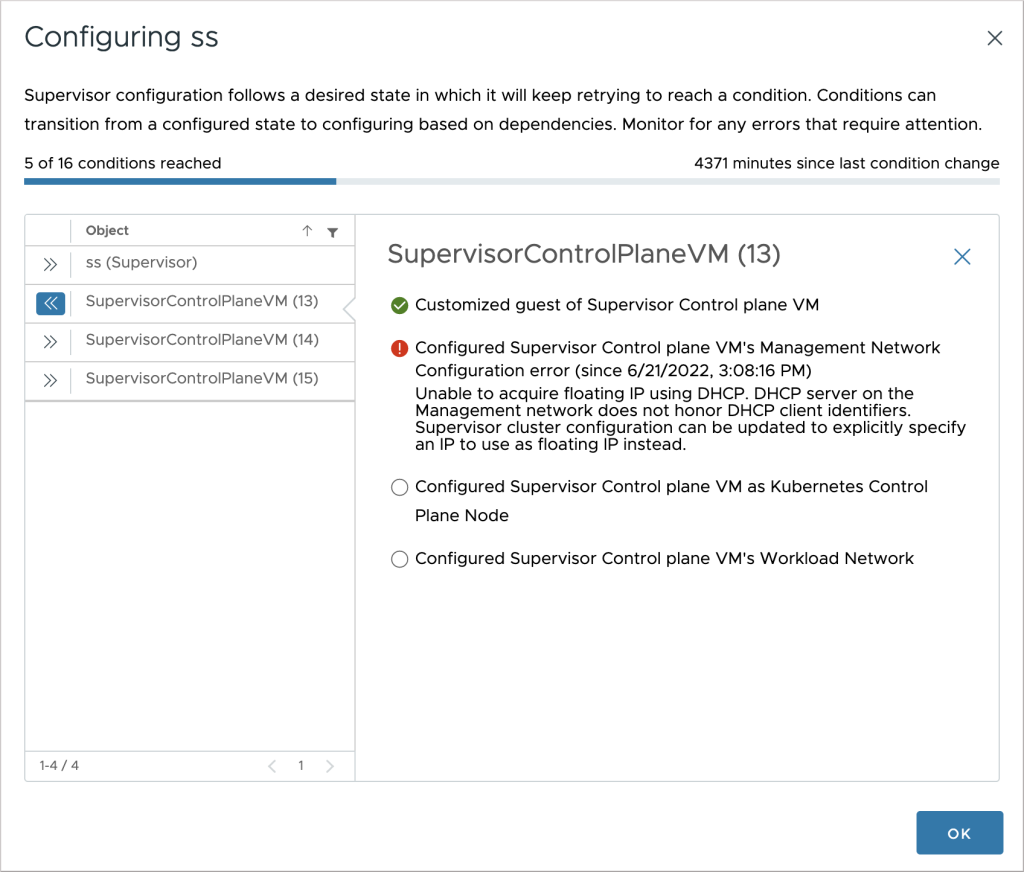
It is good to see everything turn green during a configuration operation, but what happens if there is a failure? Firstly, user shouldn’t panic upon getting an error, at least not right away. There is a chance an issue will be remediated in the next loop cycle. However, there are cases when user input is required to rectify an issue and in less common occasions, an error can be non-recoverable. When an error occurs, the status of the affected object(s) changes to Error. Clicking on the row reveals more details about the failure. Error status, in combination with an abnormal time since last condition change may indicate such non-recoverable issues.
Taking a closer look at image two, you may have noticed a new column (added as part of the vSphere 8.0 release), titled Host Config Status. When the vSphere Pod feature is supported, the column shows the overall configuration status of all ESX hosts that are part of the Supervisor. The UI upon opening the link looks very similar to what we have seen so far, with differences being the objects (rows) that represent the hosts, and the conditions that are associated with them.
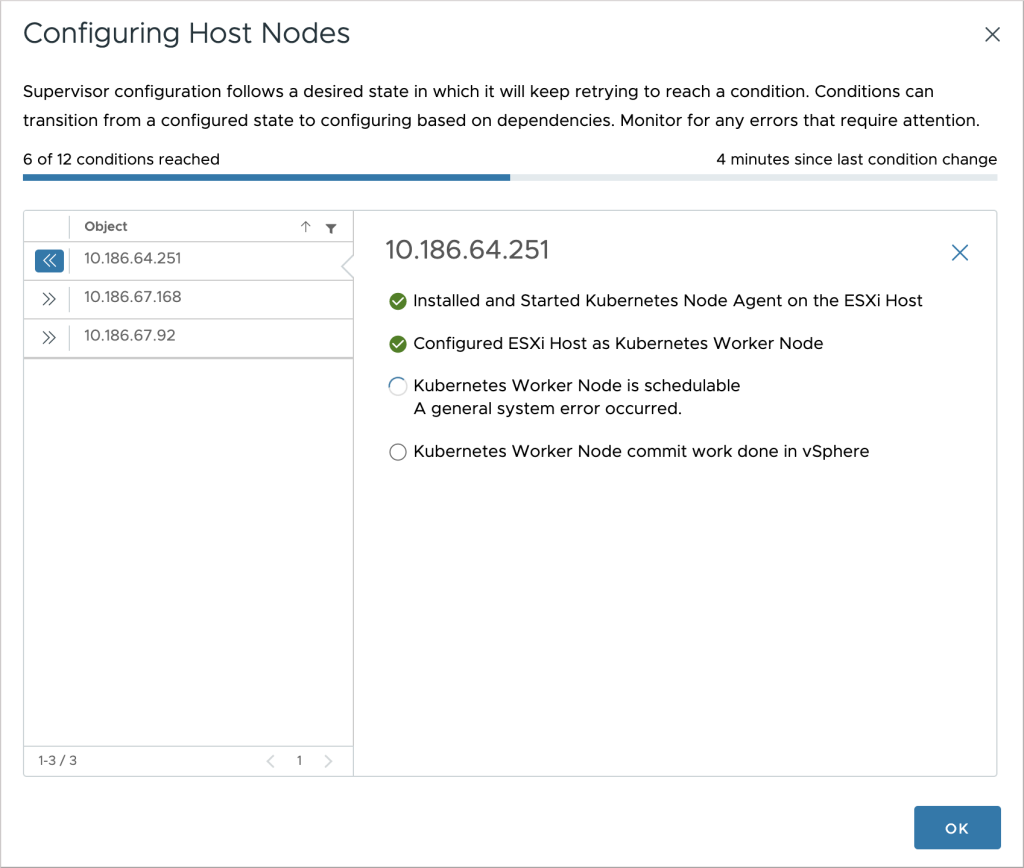
Similar UI is displayed when removing (i.e. deactivating) a Supervisor. The title of the modal changes to reflect the operation that is in progress, along with conditions set on the objects.
This is just the beginning. We are very excited with the possibilities this new UI opens up. From adding new objects and more verbose conditions, to allowing inline user input in order to remediate known issues, workload management configuration monitoring is becoming as simple as ever. Stay tuned for more updates!
Share your feedback in the comments section below or reach out to us – vSphere UI Community Team (@vSphereUI_Team).


