

The latest release of VMware Aria Operations as part of VMware Cloud Foundation (VCF) 5.2 has arrived with many new features that provide Cloud administrators with greater visibility, performance and management capabilities with a Unified Console Experience.
If you missed the Launch blog for this release, check it out here!
So, let’s do a Deep Dive into the new capabilities:
New Console Experience:
VCF and vSphere Foundation have several products and consoles so we saw an opportunity to unify the experience by bringing in a Unified Console Experience within VMware Aria Operations helping customers do their day-to-day activities seamlessly using the same console.
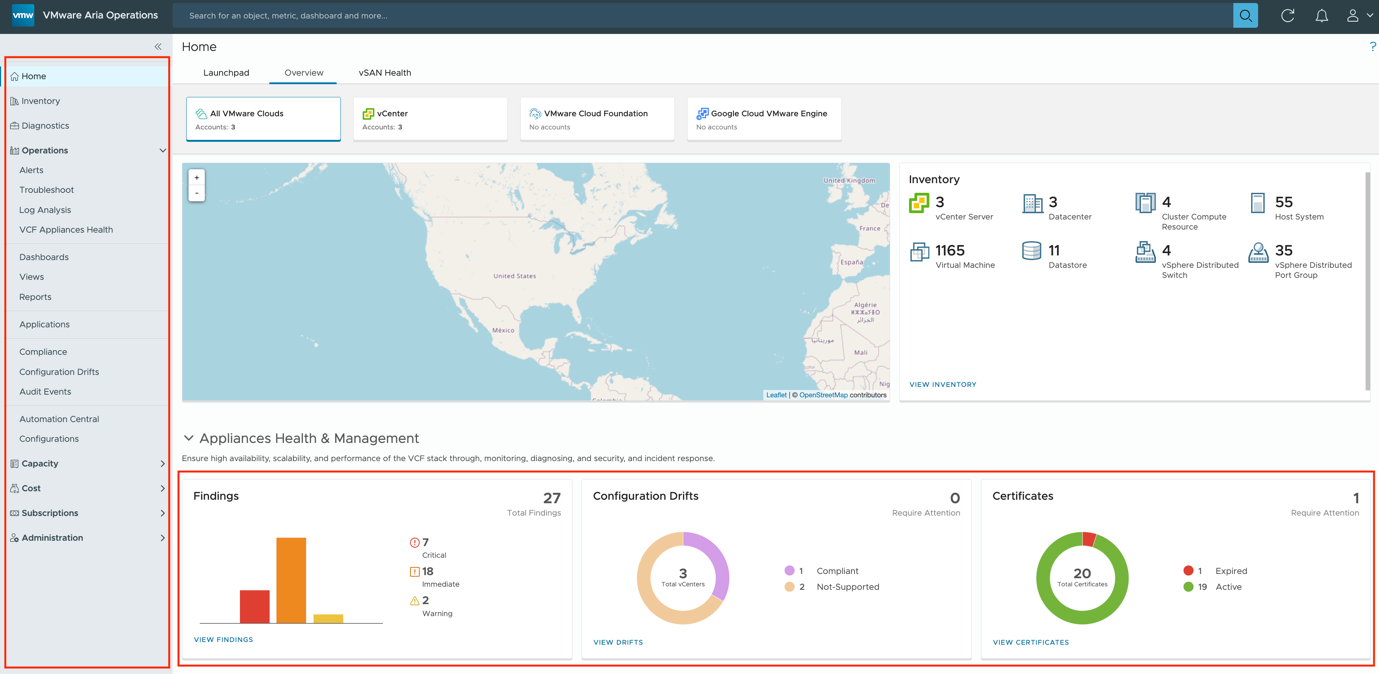
We have changed things around the User interface (UI), you will now notice that the navigation on the left-hand side is different than what you have seen as well as on the bottom part. The bottom of the Overview page has new widgets like the Findings as part of the Diagnostics, Configuration Drifts anything that is drifted from a vCenter level that is set in a template as well as centralised Certificates visibility for all the components within the VCF and vSphere Foundation components.
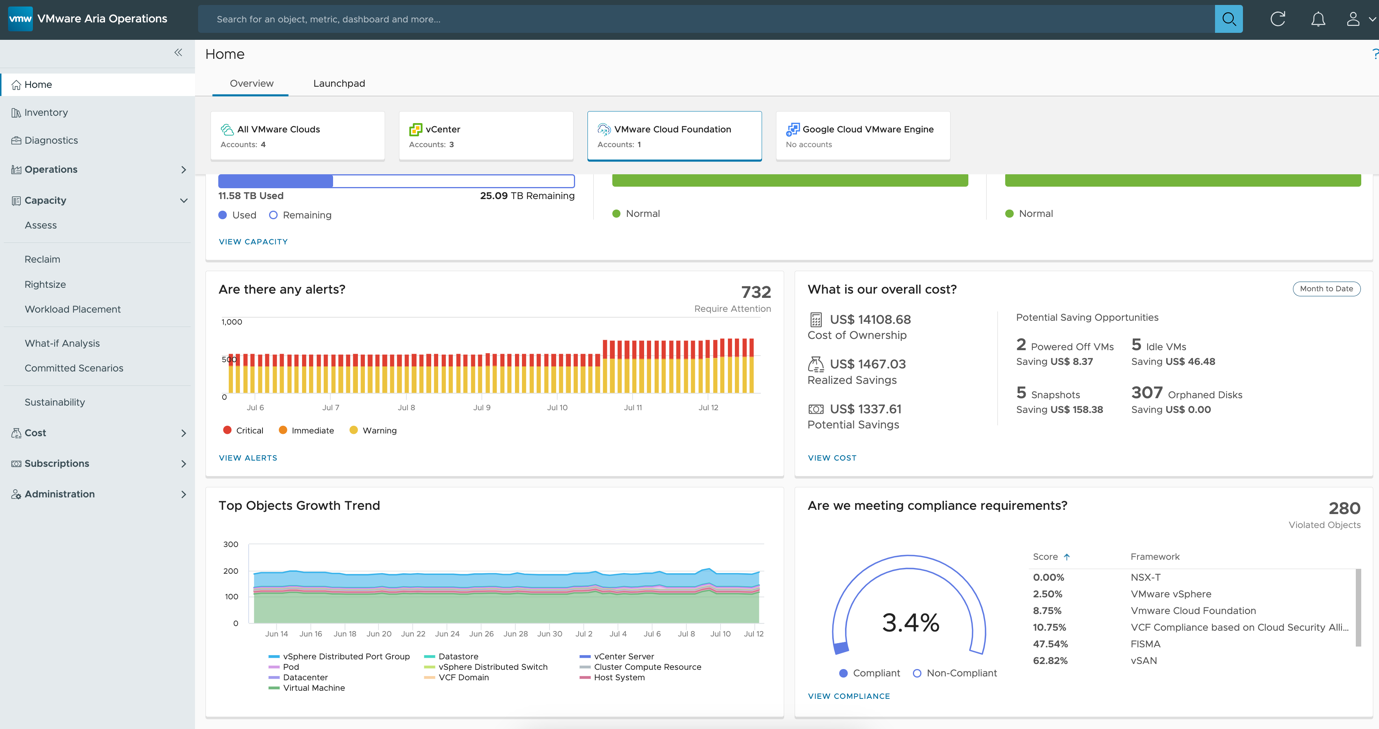
As you scroll down, you see the top object’s growth within your VCF deployments, and the last widget is on Compliance to know how compliant you are and helps customers maintain a consistent configuration and follow best practices across VCF and vSphere Foundation components.
Global Inventory:
The new Global inventory allows you to view inventory from multiple perspectives that include Compute, storage, Network and custom groups.
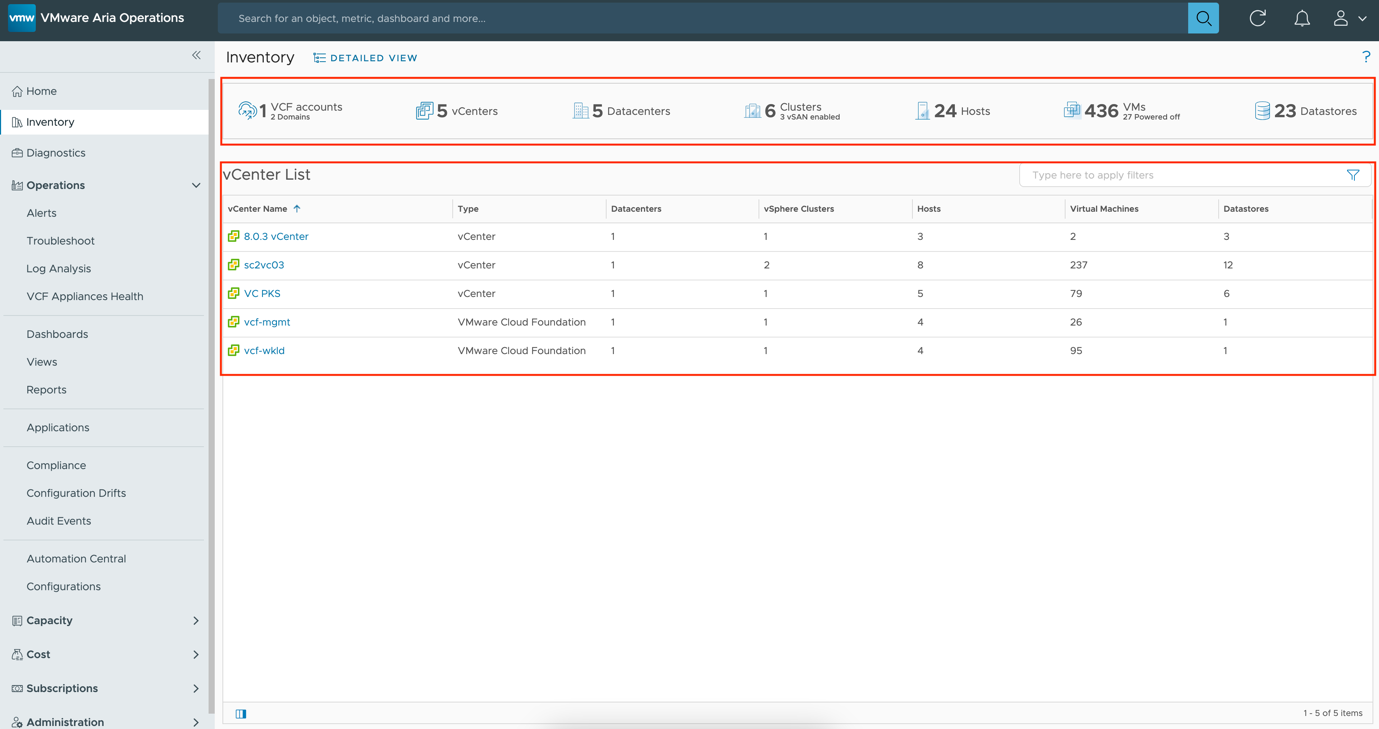
If you notice the navigation on the left side, this is one change where we have a Global Inventory view instead of the Object browser. The Basic view shows the summary of all the VCF environments and vSphere foundation deployments containing the vCenters, Host Clusters, Hosts, VMs and datastores.
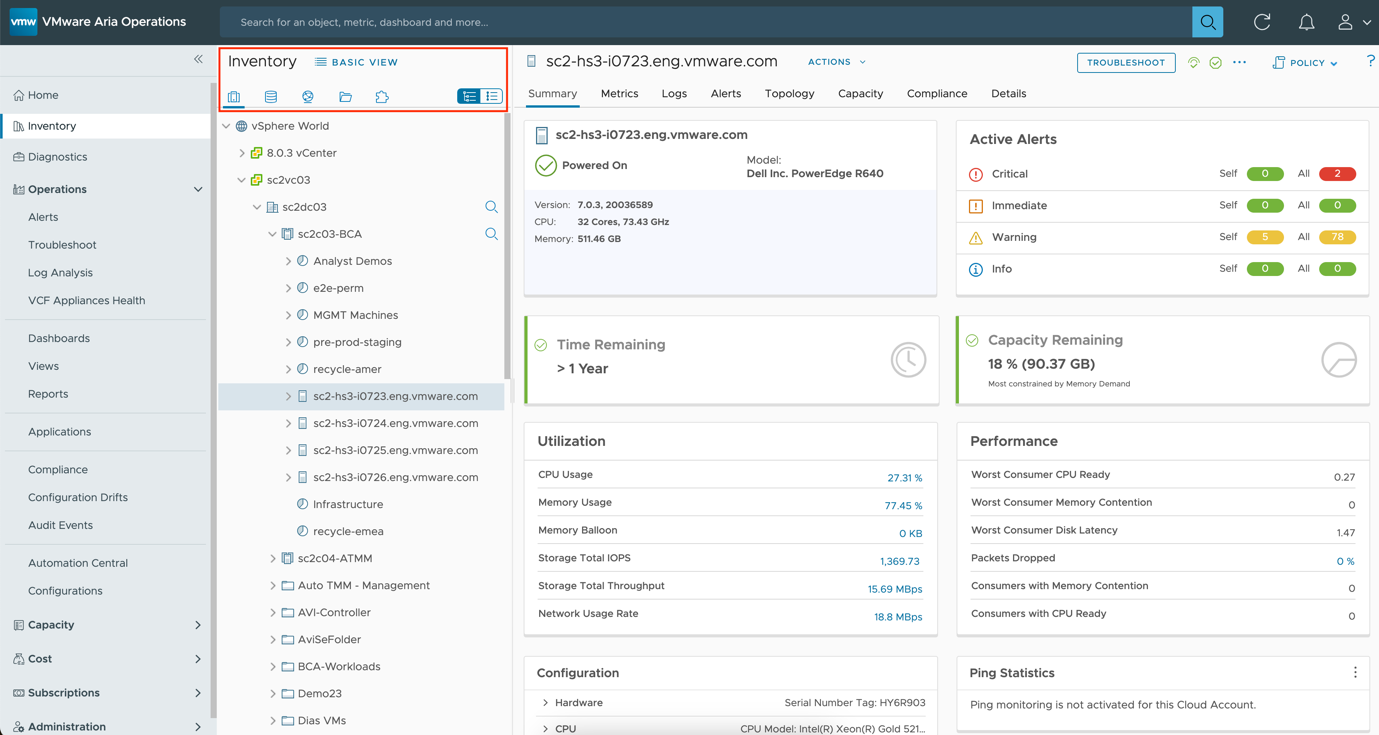
Now when we switch to the detailed view, we get very much like the Object browser in the past, we can use the Tree view here and look at all the objects grouped by vSphere Hosts and clusters, vSphere storage, vSphere networking, custom groups and integrations with similar look and feel of the vCenter user interface.
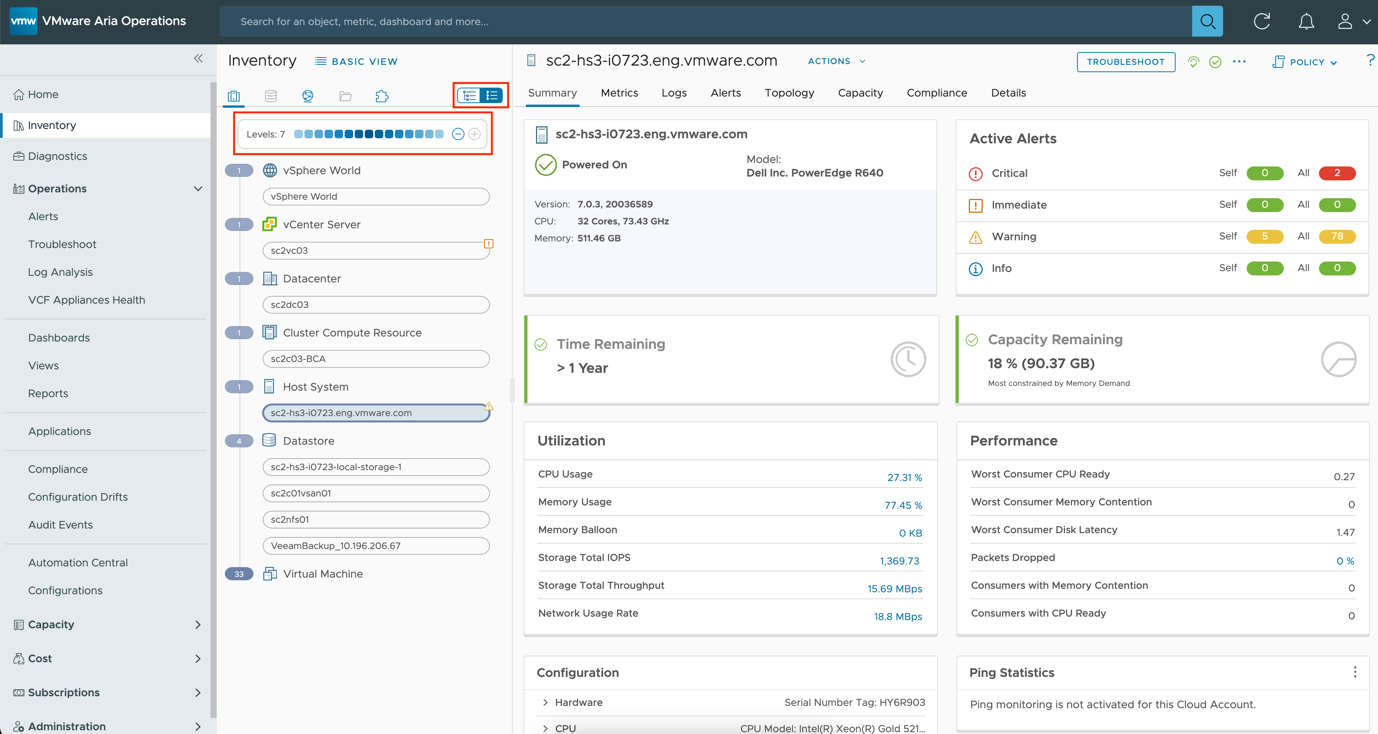
Then you have the List view where everything pertains to the relationship scope. At the top, there is level 7 (blue slider), we can change those levels just for the objects themselves to go out to any related objects up to 7 levels.
Simplified Diagnostics
We also get a new Diagnostics section within Aria Operations by converging the diagnostic capabilities from Skyline Health Diagnostics, Skyline Advisor and Aria Operations for Logs into a single experience.
With this release, we are converging these diagnostic capabilities into a single experience delivered within the new Aria Operations console. With this convergence, customers are no longer required to install/manage additional diagnostics software. This convergence provides admins with a streamlined mechanism to quickly identify issues based on findings from skyline health diagnostics, advisor and remediate issues based on curated recommendations, help troubleshoot unknown issues that come up (additional recommendations will fall into this), also monitor operational state with Aria Operations and Aria operations for logs integration.
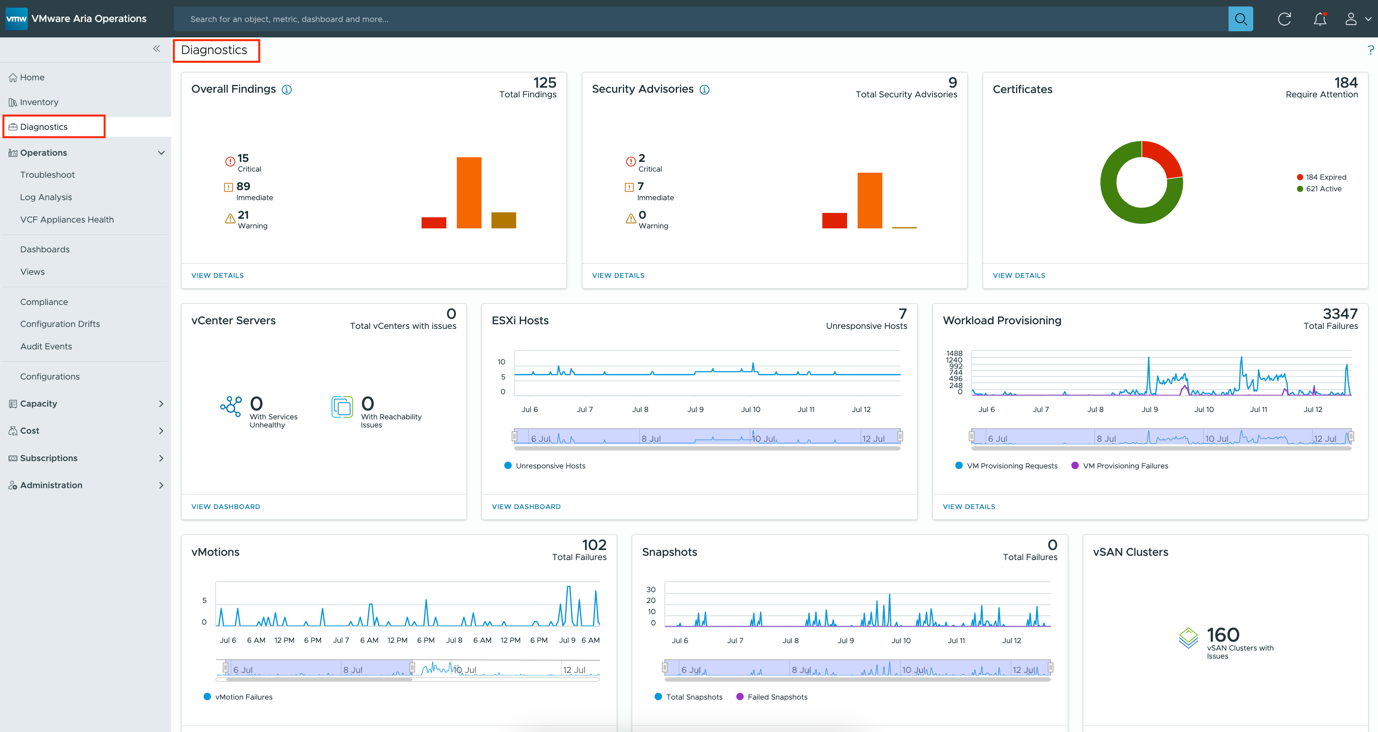
So here we see the overall Diagnostics page with findings, the Security Advisories sections and the Centralised Certificates visibility.
The new Certificates widget within Diagnostics shows a unified view of all the certificates about your infrastructure under one bucket, one interface to help solve some of the certificates-related problems and reduce the amount of effort needed to manage them.
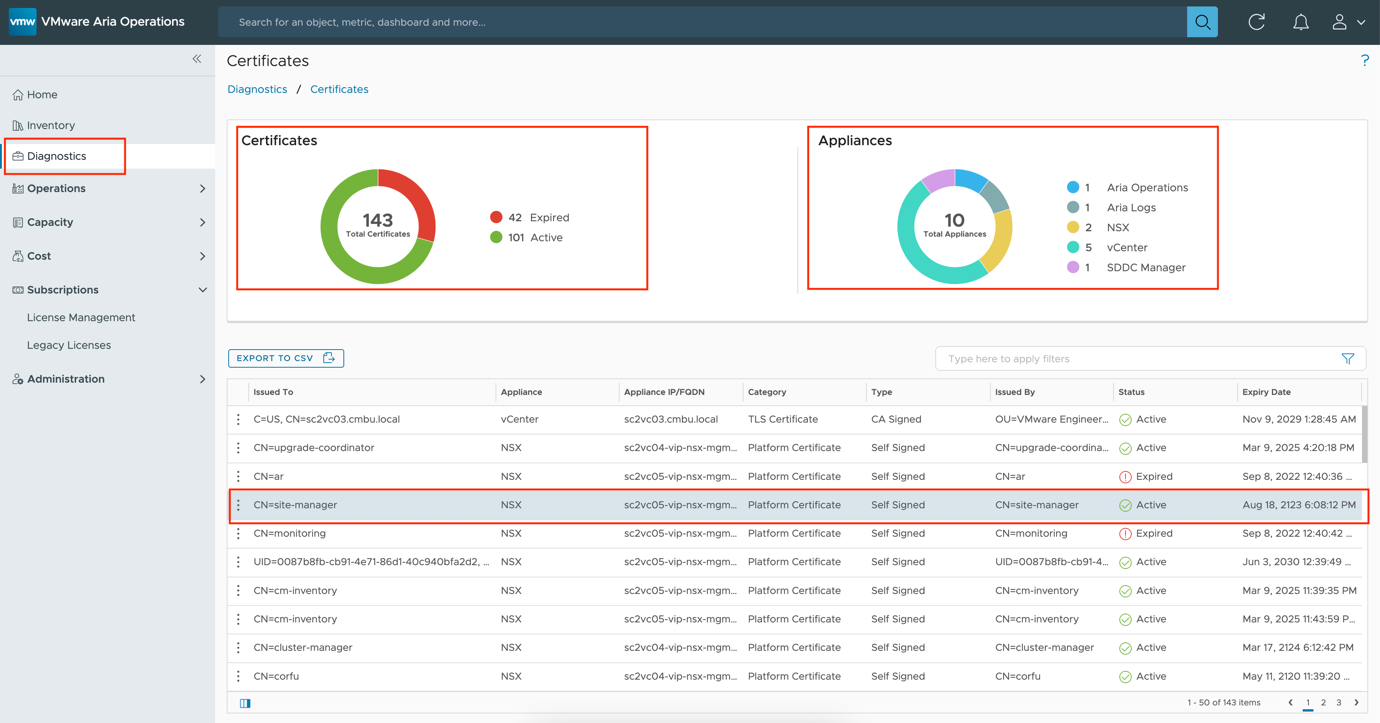
Cloud admins can now continuously monitor the status and health of certificates for all appliances to ensure they are valid. The console notifies administrators of impending certificate expirations and generates reports on certificate usage, expiration dates, and compliance status for audit and compliance purposes.
You also get insights into the vCenter Service health, unresponsive ESXi hosts status, workload provisioning failures and vSAN clusters with issues, VMotion and snapshot failures
Operations
Also, a few more things to call out under the Operations section. We can see everything in there Alerts, Troubleshooting Workbench, Log Analysis, VCF health to troubleshoot issues and Compliance to fix non-compliant objects to meet regulatory benchmarks in the environment.

A few new capabilities moved there like the Configuration Drifts where the admins can associate desired configurations with vCenters across the datacenters and check for drifts against the desired state and view drift report across all vCenters within the VCF or vSphere foundation. On demand-drift detection is also supported.

The new Audit Events feature which helps to keep a track of all VCF platform interactions such as searches, user logins, logouts, capability checks, and configuration modifications. It helps provides visibility into suspicious access events and policy violations.

And, then the Configurations tab where the policy definitions, Alert Definitions, Business applications, datacentres, service discovery, cost drivers, super metrics are defined. So, anything you need to configure is directly here under Configurations.
Capacity and Cost
So, when it comes to Capacity planning, the biggest challenge for most businesses is avoiding overprovisioning or underutilising resources that result in higher operating costs.
One of the common feedbacks around the capacity engine was that “customers don’t know how they arrive to rightsizing no’s and recommendations and is more like a black box”.
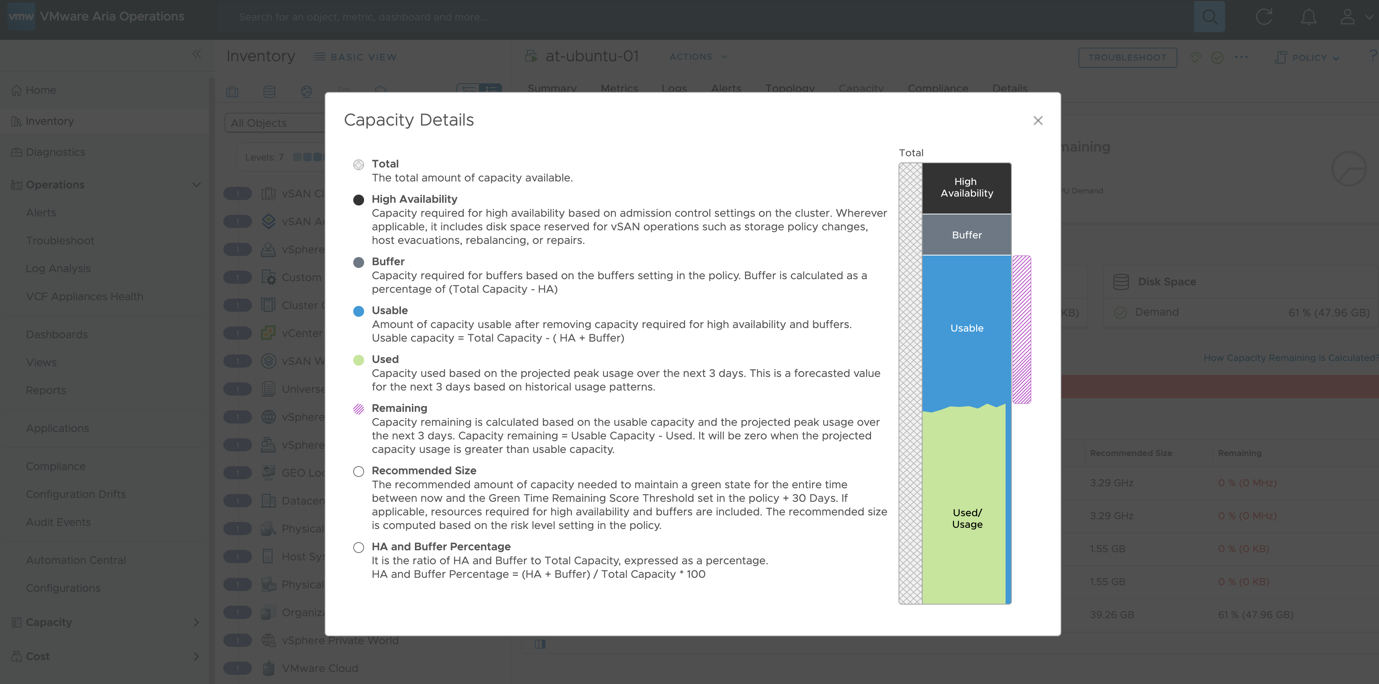
So, in this release, we did a few things to demystify what’s happening, add more flexibility and build more trust in the capacity recommendations.
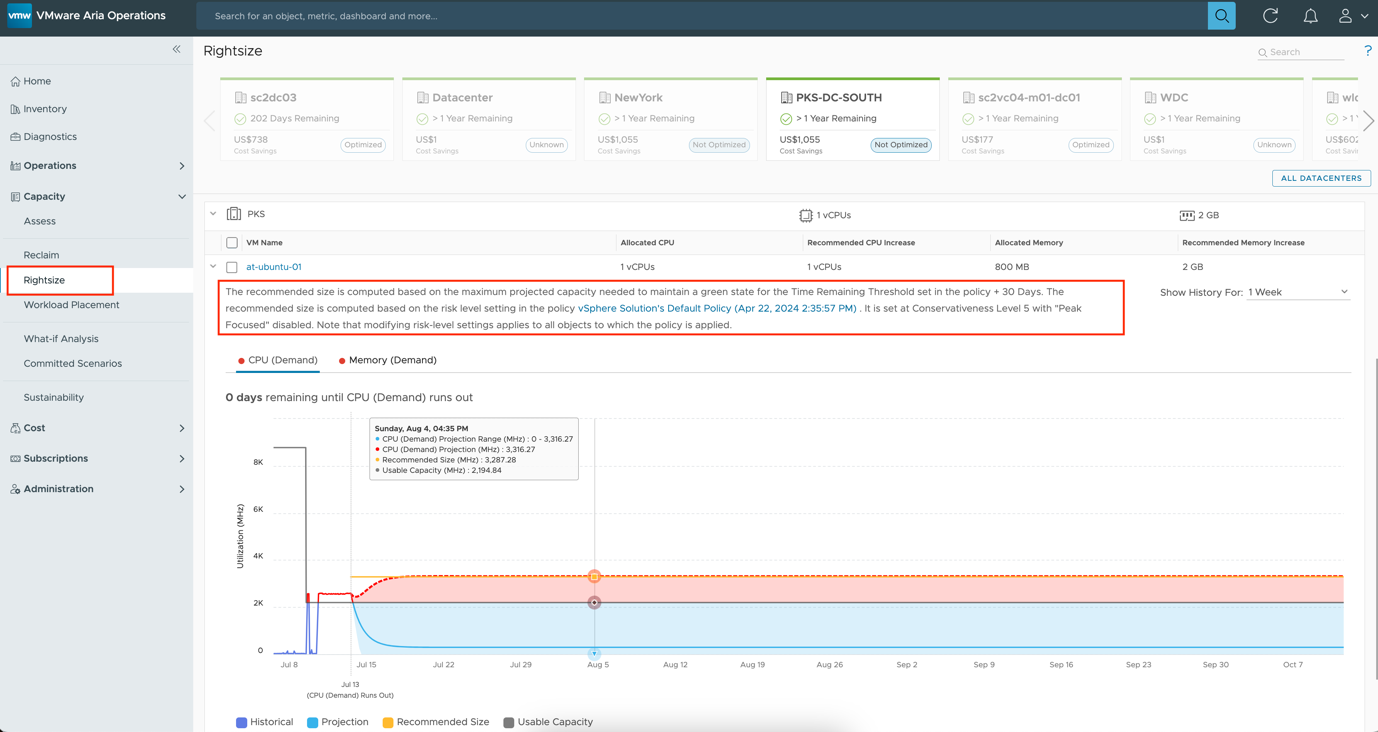
First, the customer wanted to understand how Aria Operations arrived at the right-sizing recommendations, so we made the Right-Sizing Rationale easier to understand with detailed explanations that are associated with the various Policies that have been implemented.
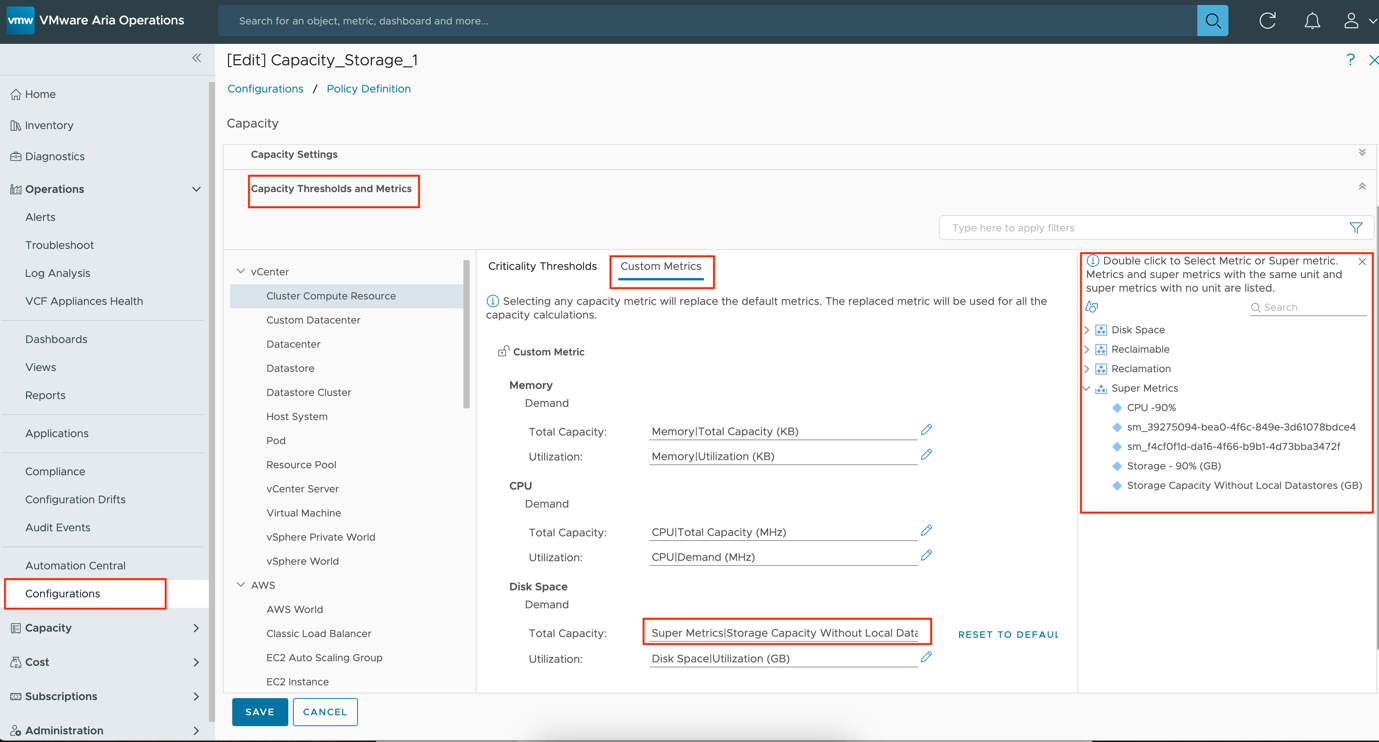
Customers also wanted to go beyond the out-of-the-box (OOTB) metrics that Aria Operations used to derive capacity numbers, so this release gives customers the flexibility to create their own custom metrics or super metrics in the policies so that the capacity engine can use those custom metrics to compute and measure capacity trends how they want to.
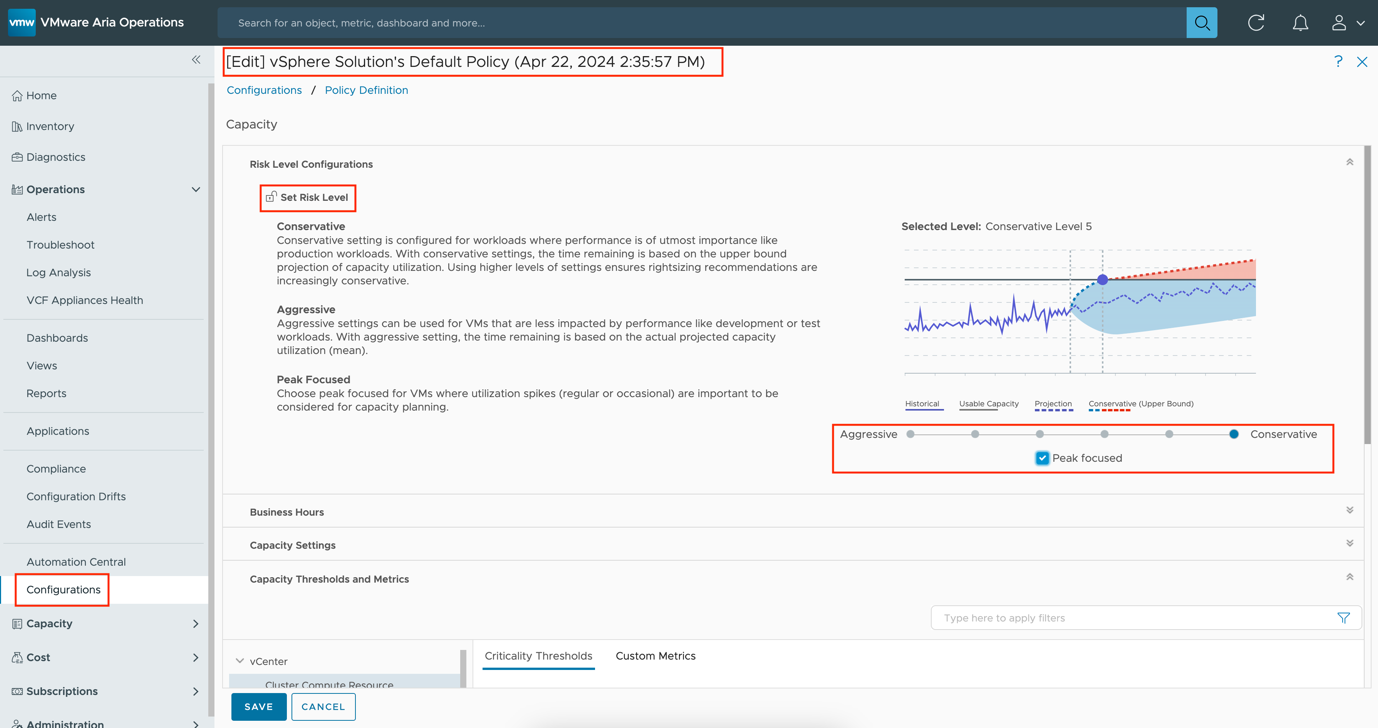
And finally, customers also wanted more insights into how Aria Operations factored the Risk levels (running the spectrum from Aggressive to Conservative), into its right-sizing calculations, giving the ability to include utilisation spikes in their capacity planning.
So, these capacity enhancements now provide customers with:
- Improved capacity projections through customised metrics used in capacity computations
- And a Simplified experience to select the risk tolerance of capacity projections.
Cost Management also has a quite several enhancements in this release. The first being the VMware Software License Cost Driver update.
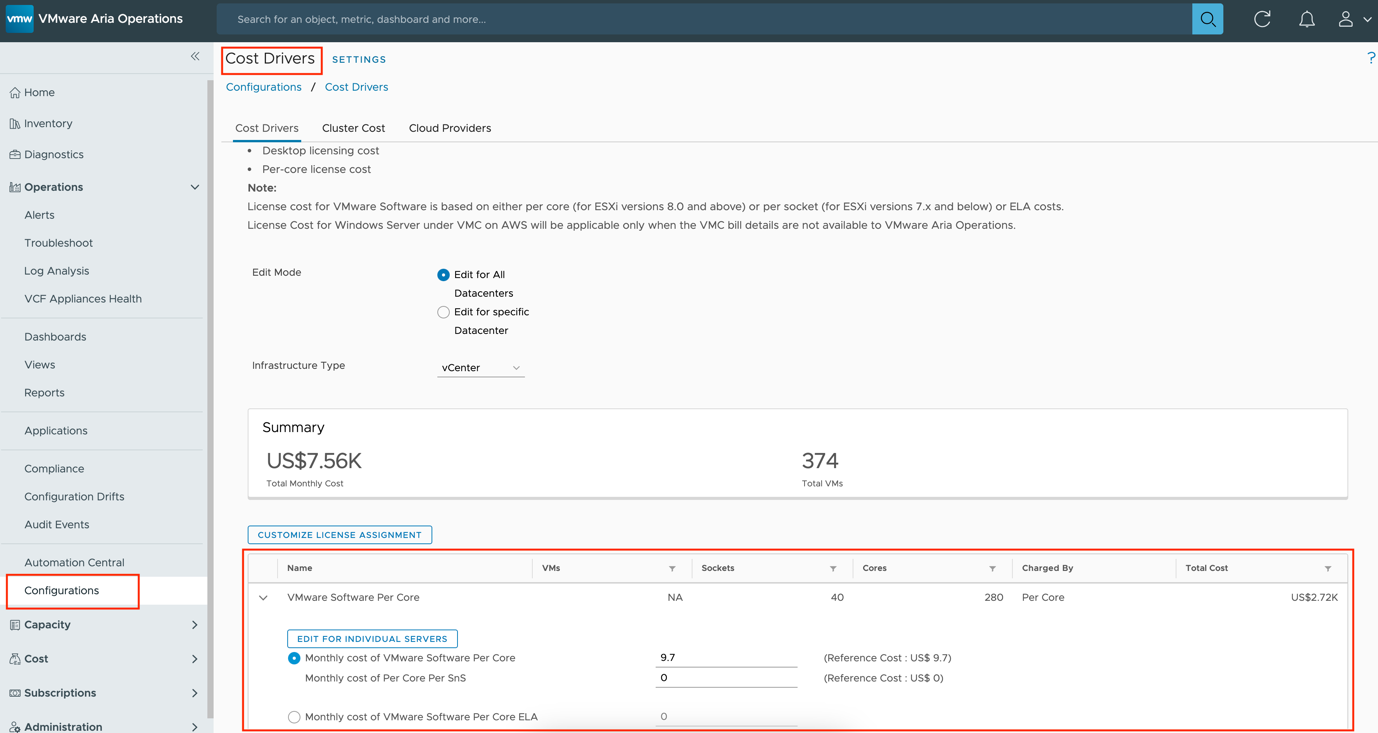
Since the VMware Software license is now sold per core, customers were facing difficulty in defining the incurred cost per ELA or CPU Socket. Now Customers can define Cost Drivers for VMware Software Per Core, as opposed to Per Socket, within the application.
This cost can even be edited if a customer received a discount or if they want to include add-ons, which makes expense tracking even more accurate.
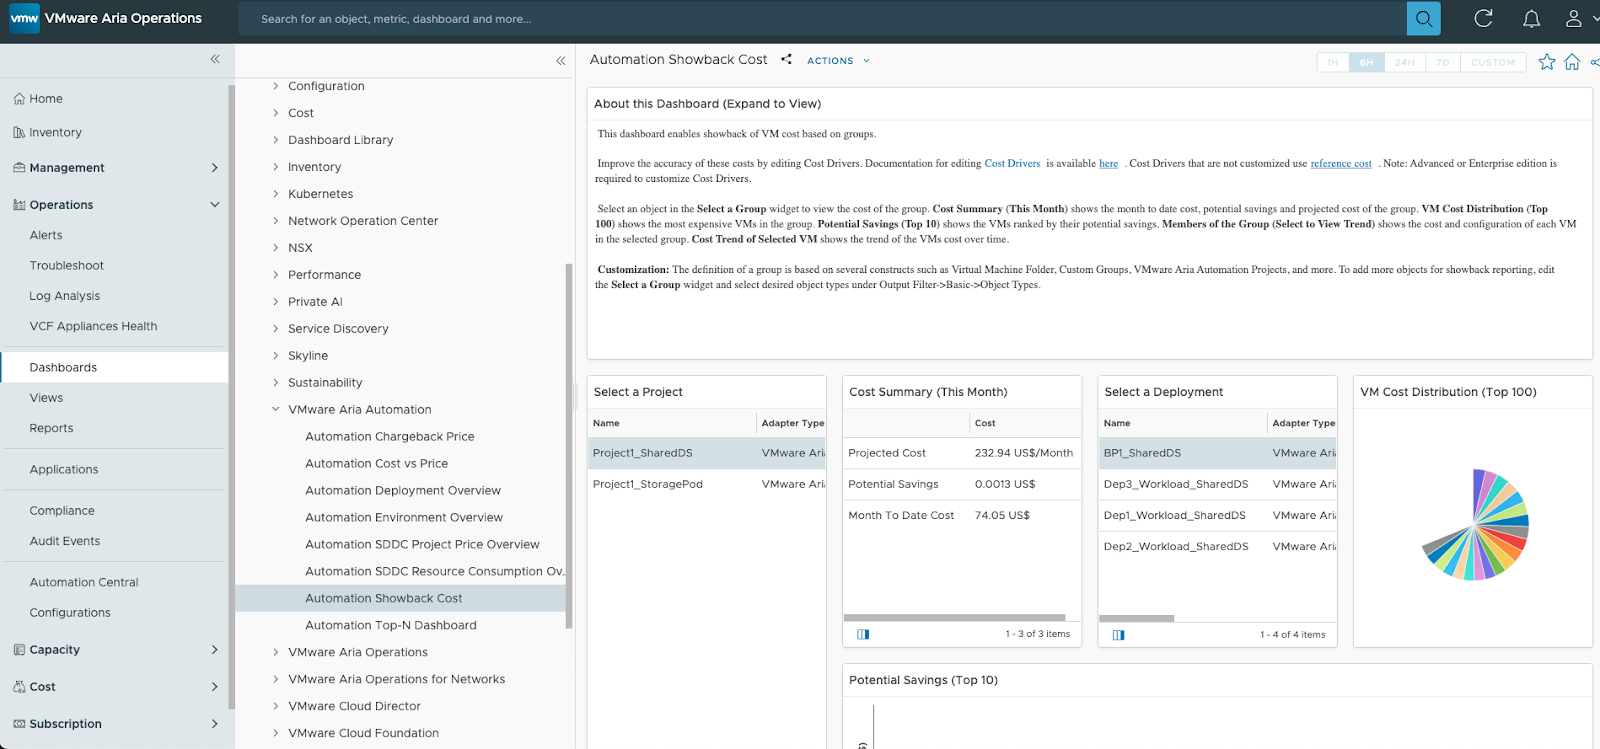
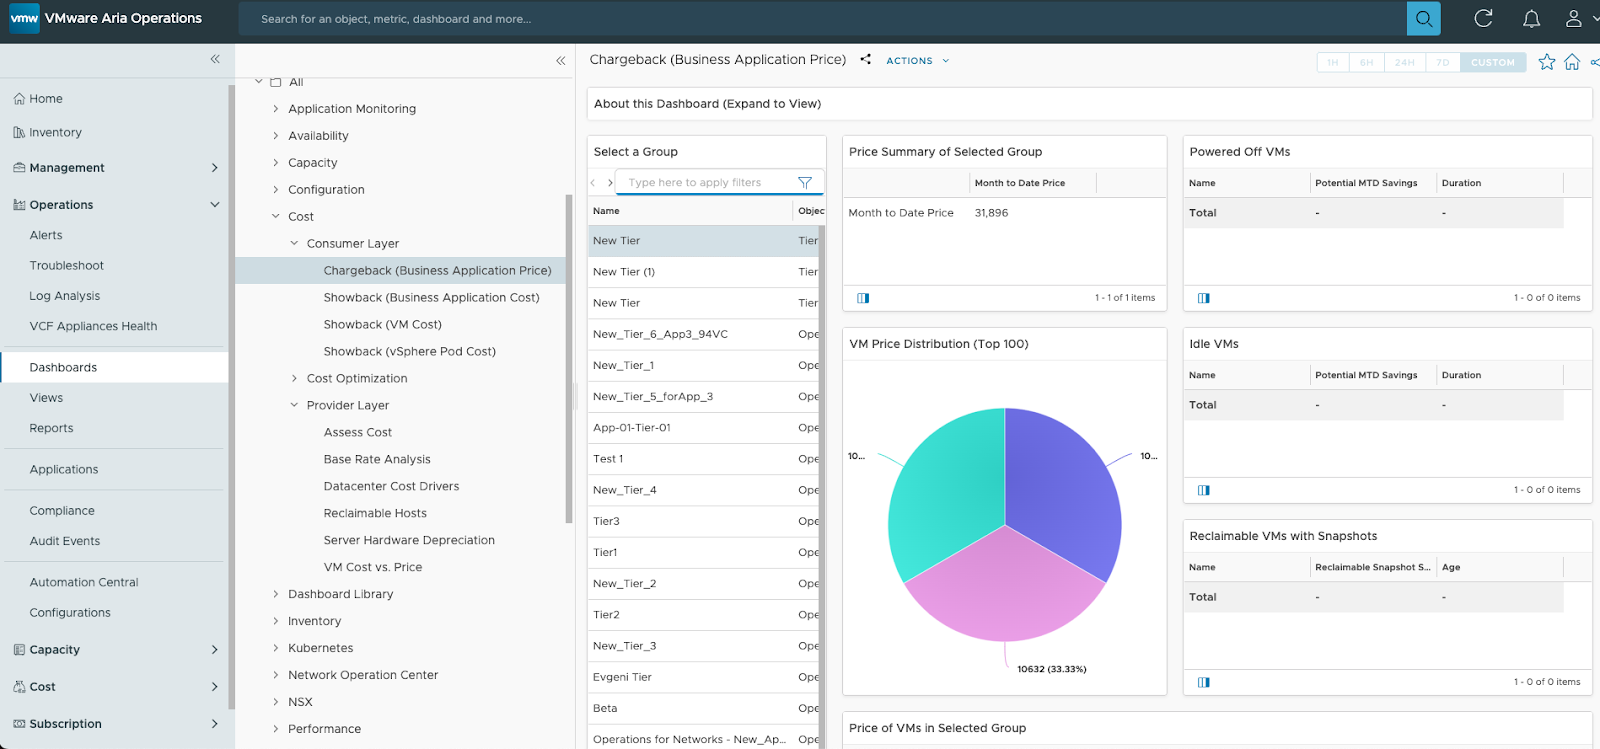
This release also provides Cost metrics for Aria Automation objects like VMs, Projects and Deployments through the Showback and Chargeback dashboards. This will help businesses get insights into how much a project or deployment costs.
You also get better insights into the Cost metrics of Business Applications and tiers, including those imported from Aria Operations for Networks.
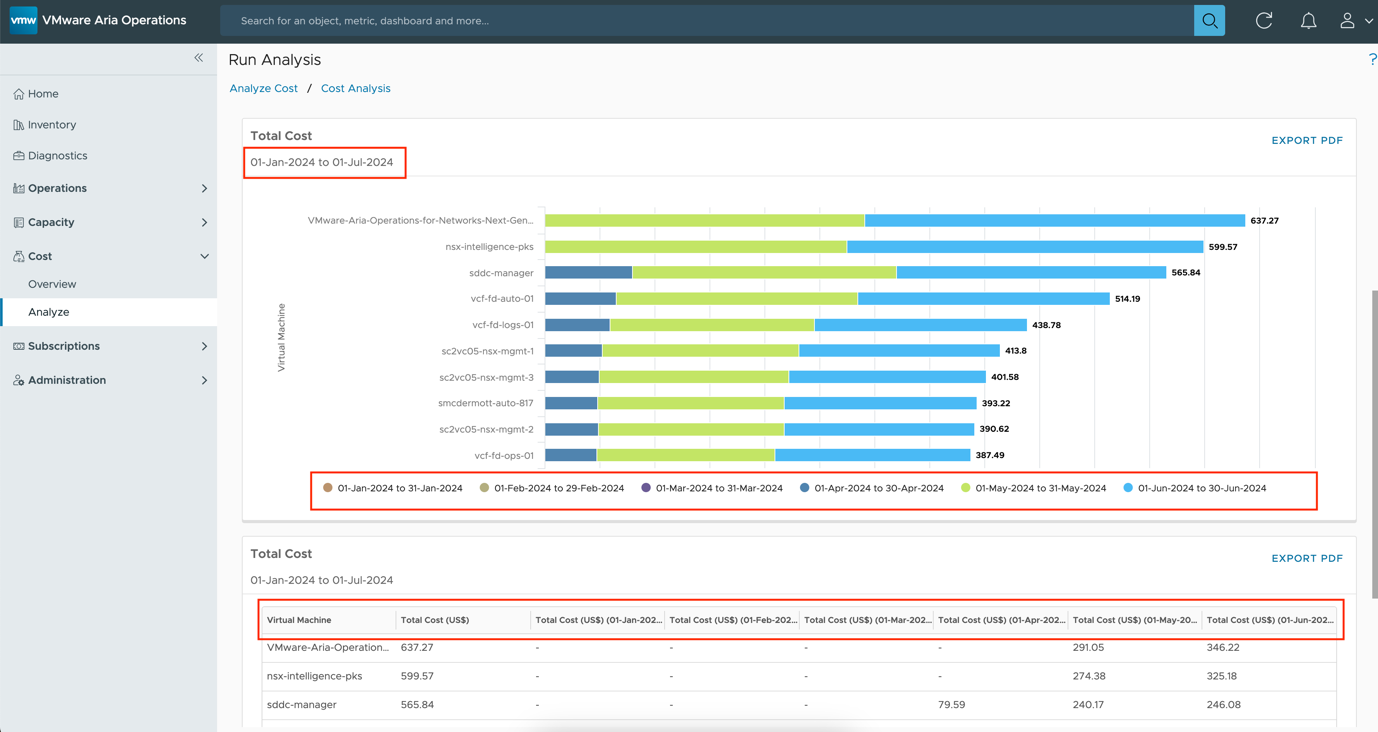
Also, Better Cost Analysis reports show cost metrics distribution on a month-to-month basis and not averaged values.
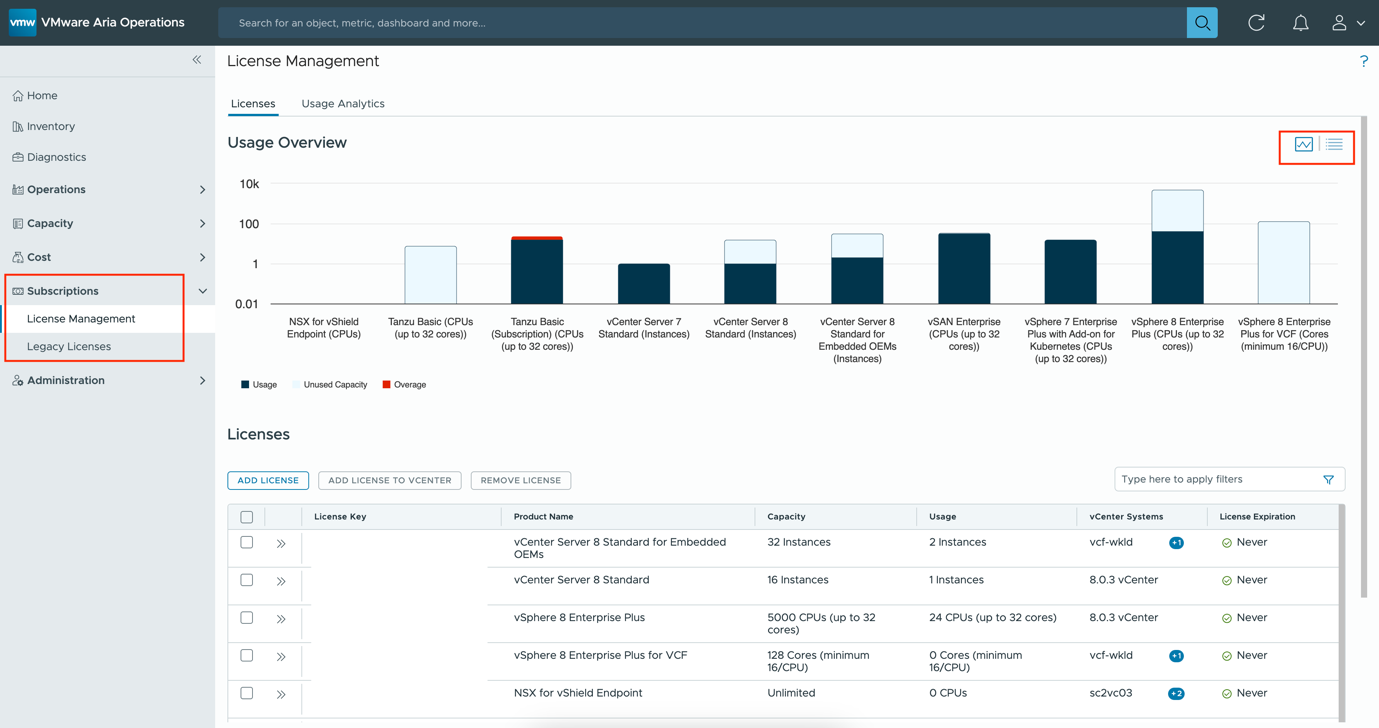
Subscriptions – Unified License Management
The New Console Experience also gives customers a single place to manage License keys across VCF and vSphere foundation deployments and also provides a point-in-time and historical view of license consumption.
These capabilities provide customers with:
- Reduced administrative overheads through centralised management
- More accurate license tracking
- Time/Effort savings when auditing and planning license entitlements
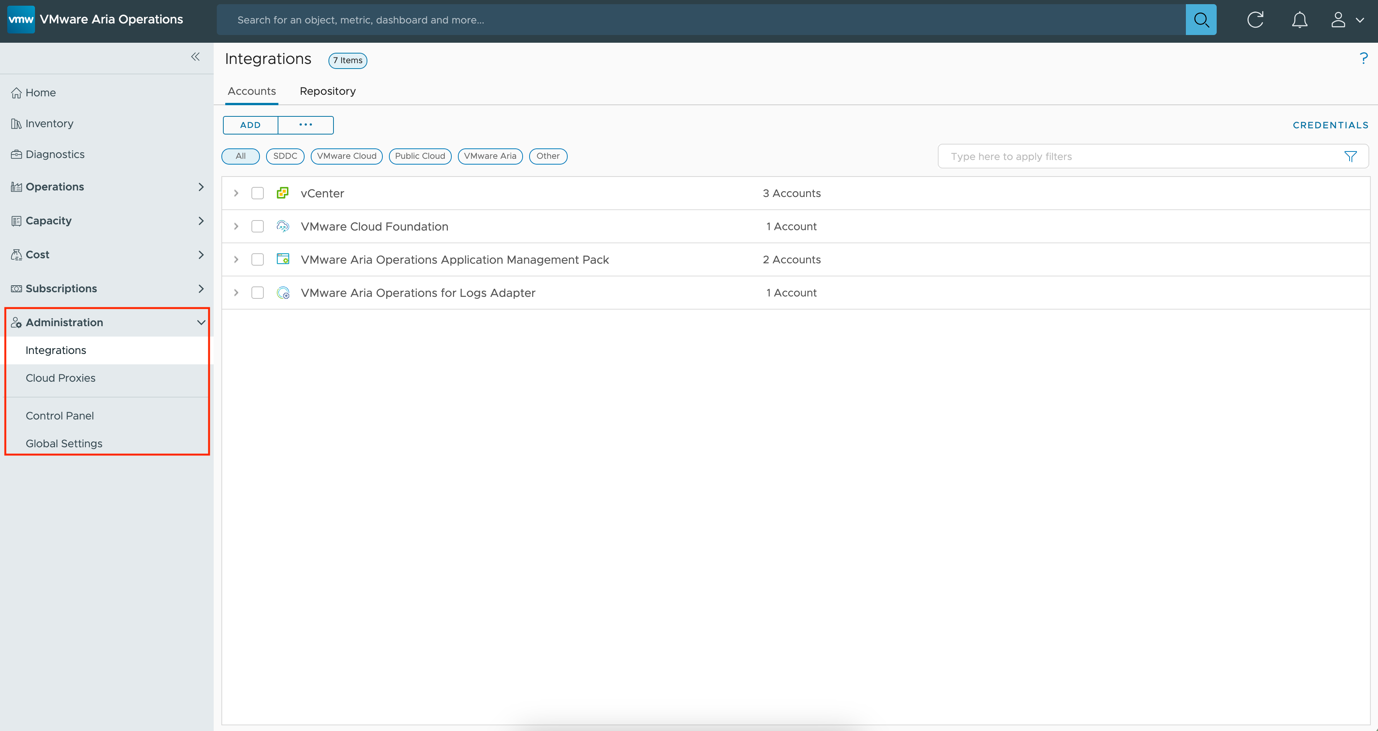
And under Administration, we have Integrations and Cloud Proxies settings which used to be further up and had its menu item. Now it is under Administration, along with the Control Panel where you can manage the Access control, authentication services, support logs and all of that.
Improved Visualisations and Usability
In this release, you see a new “Health-Check” Dashboard to gain insights into the environment to prevent alerts during the day. So, the focus here is to be more proactive than reactive.
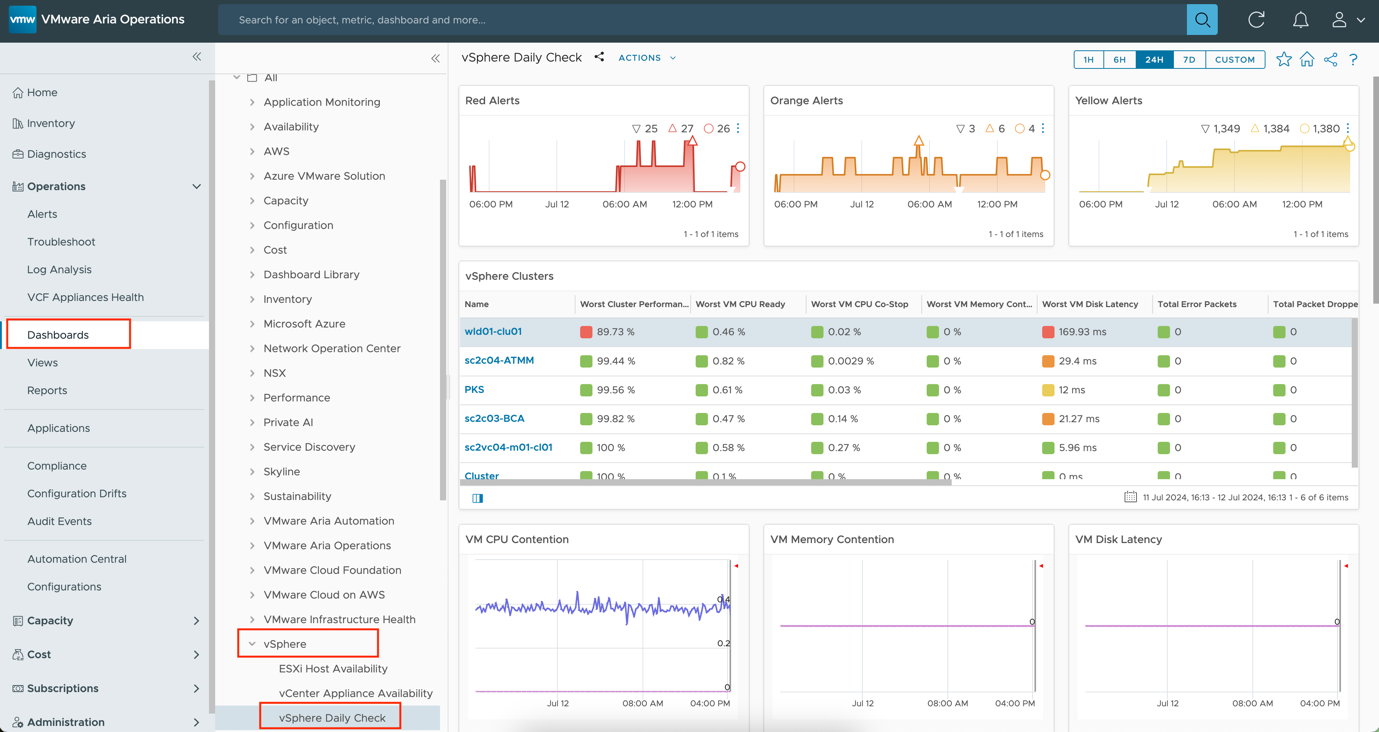
This dashboard focuses on insights made up of potential root causes and related events. It shows patterns, trends and correlations across different objects.
Some of the questions it helps answer are:
- How does the Alert trend look over the week?
- Are Clusters performing as expected?
- How many VMs were affected?
- Any VMs with potential issues?
- How Total Demand looks like?
We have also added new NOC Dashboards that are streamed Live and get auto–updated. The primary focus here is on Availability, Performance and Security.
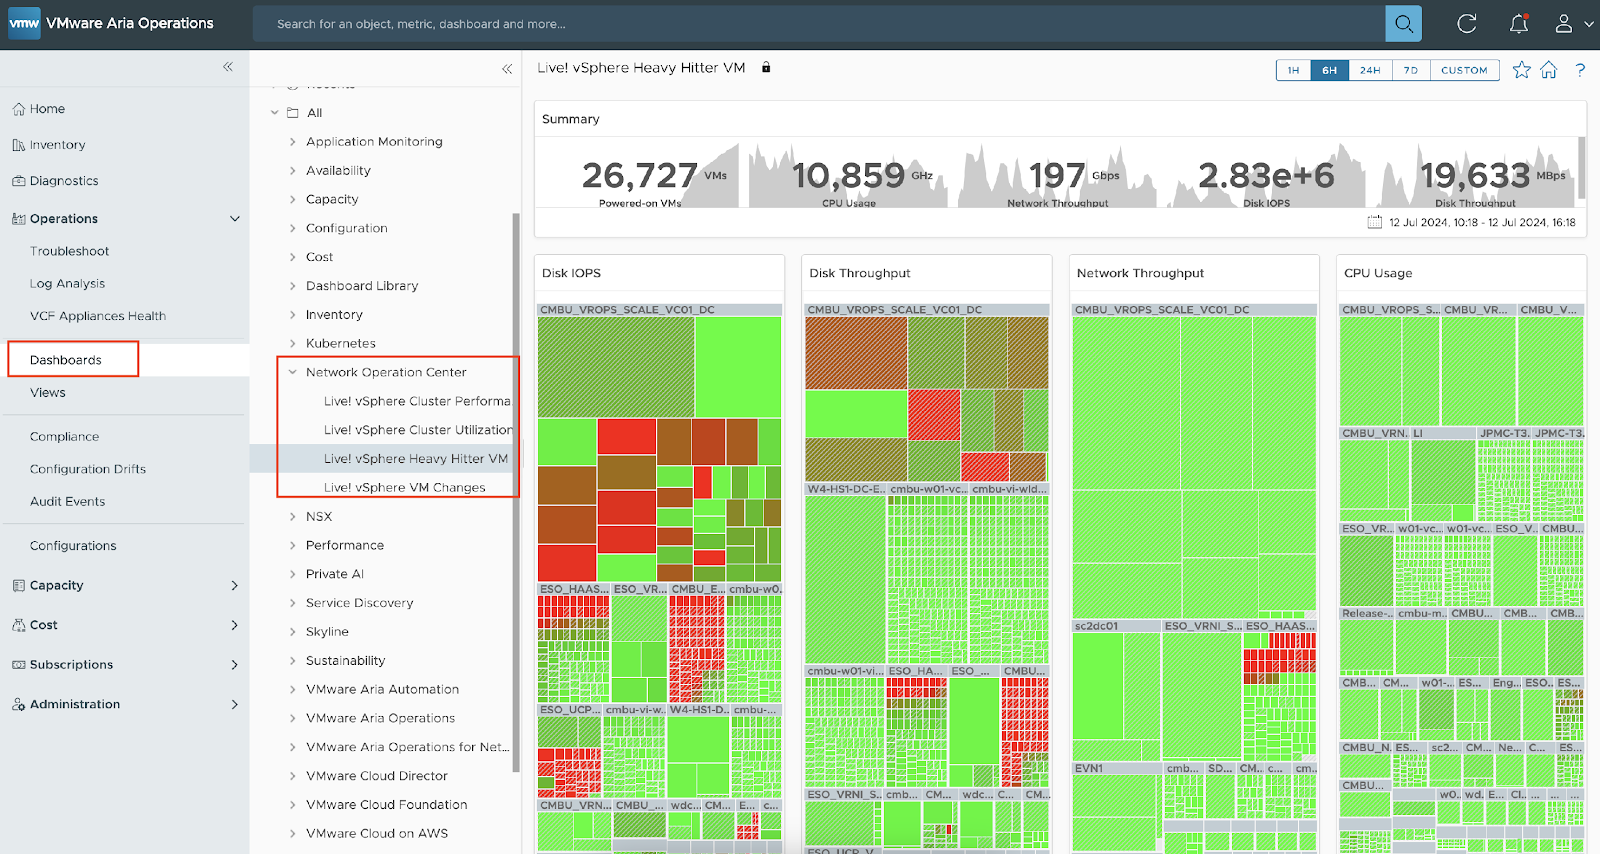
These can be projected on the NOC Big screens. Some of the questions it can help answer are:
- Are the vSphere clusters serving VMs well?
- Which VMs hit the Shared infra hard?
- Are ESXi running hot?
- Is the Environment more volatile than usual?
This release also gets 13 new metrics (listed below) that have 20-second granularity. Customers were asking for 20-second granularity as the 5-minute average is too long. The default 5-minute fails to detect the issue as a 300-second average mask-out short-burst issue. Many performance issues (e.g. disk latency, network packet drop, memory contention, CPU ready) last < 0.5 minutes.
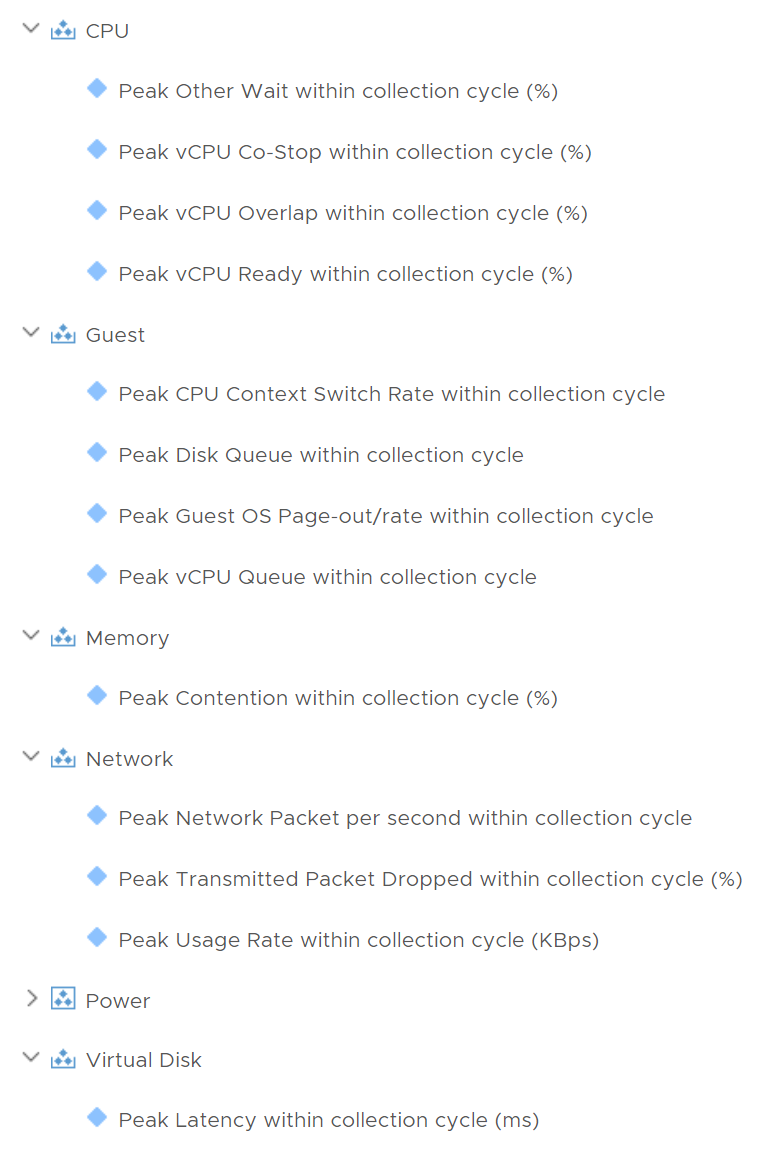
These are enabled out of the box, and they work for all VMs (no need to create policy) they are used in the NOC dashboards, VM Performance and the Network Top talker dashboard.
I also want to call out on the Enhanced Scale and performance numbers to support larger object collection sizes for better metric reporting (doubled on the number of collected objects and metrics), new vSAN Max support, Unified single sign-on for vSphere Foundation (VVF), updates to the Tanzu Kubernetes cluster integrations to get better insights into the Supervisor cluster, namespaces and workloads, Deprecation of alerts to reduce noise, better-refined Management packs and compliance packs with support for new Cloud Security Alliance (CSA) compliance pack.
For the complete list, check out the release notes!
In conclusion, the latest release of VMware Aria Operations provides Cloud administrators with greater visibility, performance and management capabilities for VCF and vSphere Foundation through a Unified Console Experience.
Discover more from VMware Cloud Foundation (VCF) Blog
Subscribe to get the latest posts sent to your email.


